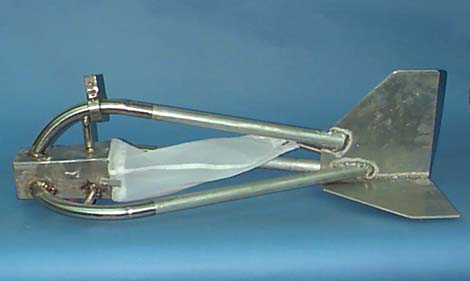
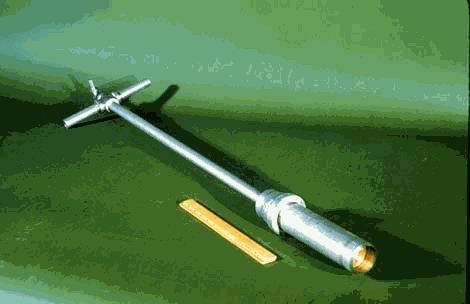
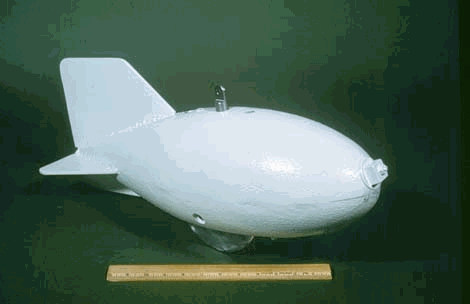
|
|
|
CHAPTER 15: SEDIMENT IN THE HYDROLOGIC CYCLE |
|
"If a large dam is constructed on an alluvial-bed river, all of the sediment normally transported will be trapped. The clear water released will tend to erode the channel bed downstream from the dam until a new equilibrium is established." Hans A. Einstein (1950) |
|
This chapter is divided into five sections. Section 15.1 describes sediment properties; Section 15.2 describes sediment production, sediment sources, and sediment yield; Section 15.3 discusses sediment transport, sediment transport formulas, and sediment rating curves, including a brief introduction to sediment routing; Section 15.4 describes sediment deposition in reservoirs; and Section 15.5 describes sediment measurement techniques. |
15.1 SEDIMENT PROPERTIES
|
|
Rainfall and surface runoff are the agents responsible for the detachment and movement of soil particles on the land surface. These soil particles are referred to as sediments. The study of sediment detachment and movement is an important subject in engineering hydrology. Indeed, the subject of sediment transcends engineering hydrology to encompass the related fields of fluvial geomorphology, sediment transport, and sedimentation and river engineering [2, 4, 25, 40].
The study of sediments in the hydrologic cycle can be divided into the following three processes: (1) production, (2) transport, and (3) deposition. These can be linked to the various liquid-transport phases of the hydrologic cycle. At the catchment level, sediment production by soil particle detachment is primarily the result of raindrop impact. Once detachment has taken place, surface runoff acts to transport sediment downslope, first as overland flow (sheet and rill flow), and eventually as stream and river flow. Deposition of sediment occurs at any point downstream where the kinetic energy of the flow is insufficient to support sediment entrainment in the flowing water.
Sediment production refers to the processes by which sediment is produced, the identification of sediment sources and amounts, and the determination of sediment yields. The source of sediment can usually be traced back to the upland catchments, although these are by no means the only source. In certain cases, streambank erosion in the lower valleys may constitute an important source of sediment.
Sediment from upland catchments is delivered to streams and rivers, wherein sediment transport takes place. Sediment transport refers to the mechanisms by which sediment is moved downstream by flowing water, either in suspension or by rolling and sliding along the river bottom.
The transport of sediment continues in the downstream direction until the flow is no longer able to carry the sediment, at which time sediment deposition occurs. Typically, the first opportunity for sediment deposition is at the entrance to reservoirs and water impoundments, where the flow is decelerated by the action of structures. Deposition is also likely to occur naturally, for instance, downstream of sudden decreases in energy slope or in situations where the capacity of the flow to carry sediment is substantially diminished. In the absence of these natural or human-made features, sediment transport by the flow may continue unabated until it reaches the estuary or ocean, at which time the flow loses its kinetic energy and sediment deposition goes on to contribute to delta growth.
Sediment Formation
Sediments are the products of disintegration and decomposition of rocks. Disintegration includes all processes by which rocks are broken into smaller pieces without substantial chemical change. The disintegration of rocks is caused either by large temperature changes or by alternate cycles of freezing and thawing. Decomposition refers to the breaking down of mineral components of rocks by chemical reaction. Decomposition includes the follwing processes: (1) carbonation, (2) hydration, (3) oxidation, and (4) solution.
Carbon dioxide (CO2), present in the atmosphere and organic sources, readily unites with water to form carbonic acid (H2CO3). Carbonic acid reacts with feldspars to produce clay minerals, silica, calcite, and other relatively soluble carbonates containing potassium, sodium, iron, and magnesium. The addition of water to many of the minerals present in igneous rocks results in the formation of clay minerals such as aluminum silicates. Many secondary minerals are formed from igneous rocks by oxidation, which is accelerated by the presence of moisture in the air. Solution is another important mechanism in the alteration of igneous rock. Oxygen combines with other elements to form sulfates, carbonates, and nitrates, most of which are relatively soluble. The amount (by weight) of dissolved solids carried by streams in the contiguous United States has been estimated at more than 50 percent of the amount of suspended sediment [32].
Particle Characteristics
The characteristics of mineral grains help describe the properties of sediments. Among them are: (1) size, (2) shape, (3) specific weight and specific gravity, and (4) fall velocity.
Size. Particle size is a readily measured sediment characteristic. A widely accepted classification of sediments according to size is shown in Table 15-1. Five groups of sizes are included in this table: (1) boulders and cobbles, (2) gravel, (3) sand, (4) silt, and (5) clay. Boulders and cobbles can be measured individually. Gravel-size particles can be measured individually or by sieving. Sand-size particles are readily measured by sieving. A No. 200 screen is used to separate sand particles from finer particles such as silt and clay. Silt and clay particles are separated by measuring the differences in their rate of fall in still water.
| ||||||||||||||||||||||||||||||||||||||||||||||||||||||||||||||
Shape. Particle shape is numerically defined in terms of its sphericity and roundness. True sphericity is the ratio of the surface area of a sphere having the same volume as the particle to the surface area of the particle. The practical difficulty of measuring true sphericity has led to an alternate definition of sphericity as the ratio of the diameter of a sphere having the same volume as the particle (i.e., the nominal diameter) to the diameter of a sphere circumscribing the particle. Accordingly, a sphere has a sphericity of 1, whereas all other shapes have a sphericity of less than 1.
Roundness is defined as the ratio of the average radius of curvature of the particle edges to the radius of the largest inscribed circle. It refers to the sharpness of the edges of sediment particles and is commonly used as an indicator of particle wear.
In sediment studies, the shape factor is often used as an indicator of particle shape:
|
c
SF = ________ (ab)1/2 | (15-1) |
in which SF = shape factor and a, b, and c are three orthogonal particle length dimensions. According to Corey [12], a is the longest, b is the intermediate, and c is the shortest length dimension. However, according to McNown and Malaika [34], c is measured in the direction of motion, and a and b are perpendicular to c.
Specific Weight and Specific Gravity. The specific weight of a sediment particle is its weight per unit volume. The specific gravity of a sediment particle is the ratio of its weight to the weight of an equal volume of water. Most sediment particles consist of either quartz or feldspar, which are about 2.65 times heavier than water. Therefore, the specific gravity of sediments is generally considered to be about 2.65. Exceptions are heavy minerals (for instance, magnetite, with specific gravity of 5.18), but these occur rather infrequently.
Fall Velocity. The fall velocity of a sediment particle is its terminal rate of settling in still water. Fall velocity is a function of size, shape, and specific weight of the particle, and the specific weight and viscosity of the surrounding water. For spherical particles, the fall velocity (derived from a balance of submerged weight and drag) can be expressed as follows:
|
4 g ds γs - γ
w = [ ___ ______ ________ ] 1/2 3 CD γ | (15-2) |
in which w = fall velocity, g = gravitational acceleration, ds = particle diameter, CD = drag coefficient (dimensionless)
[ τ = (1/2) CD ρ w2 ],
ρ = density of water, γ = specific weight of water,
and
The drag coefficient is a function of the particle Reynolds number R, defined as follows:
|
w ds
R = ______ ν | (15-3) |
in which ν = kinematic viscosity of the fluid. For particle Reynolds numbers less than 0.1, the drag coefficient is equal to CD = 24/R. Substituting this value of CD into Eq. 15-2 leads to Stokes' law:
|
g d 2 γs - γ
w = [ _______ ] ( ________ ) 18 ν γ | (15-4) |
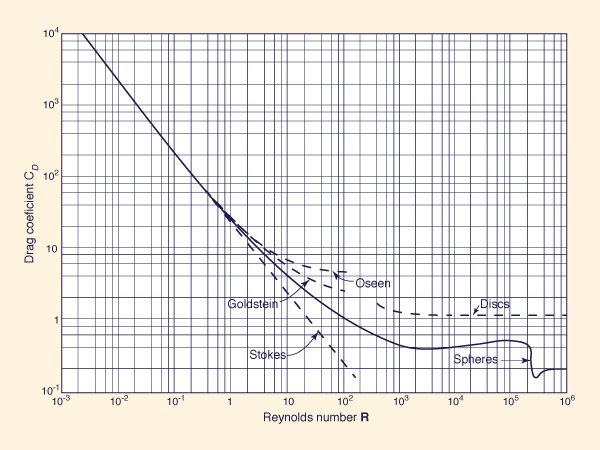
For particle Reynolds numbers greater than 0.1, the drag coefficient is still a function of Reynolds number, but the relationship cannot be expressed in analytical form. The relationship of CD versus R for a wide range of particle Reynolds numbers is shown in Fig. 15-1 [38].
Figure 15-1 Drag coefficient versus particle Reynolds number [38]. |
Example 15-1.
Calculate the fall velocity of a spherical quartz particle of diameter ds = 0.1 mm and drag coefficient CD = 40.
Using Eq. 15-2, with γs = 2.65 g/cm3, and γ = 1 g/cm3,
g = 9.81 m/s2, ds = 0.0001 m, the fall velocity is: |
In many applications, the drag coefficient is not known a priori;
in this case, an iterative solution is warranted.
A particle Reynolds number is assumed, and the drag coefficient is obtained from
Example 15-2.
Calculate the fall velocity of a spherical quartz particle of diameter
ds = 0.1 mm and water temperature
Set up an iterate procedure using the following steps: (1)
assume a Reynolds number Rold, (2)
calculate the drag coefficient CD,
(3) calculate the fall velocity
Using ONLINE FALL VELOCITY,
the answer, after 12 iterations, is: |
Standard fall velocity. Since fall velocities vary with fluid temperature and viscosity, two particles of the same size, shape, and specific gravity, falling on two fluids of different viscosity, or in the same fluid at different temperatures, will have different fall velocities. To provide a measure of comparison, the concept of standard fall velocity was developed [23]. The standard fall velocity of a particle is the average rate of fall that it would attain if falling alone in quiescent water of infinite extent at the temperature of 24°C. Likewise, the standard fall diameter of a particle is the diameter of an equivalent sphere having the same standard fall velocity and specific gravity.
Size Distribution of Sediment Deposits
An important property of sediment deposits is the size distribution of its individual particles. Particle size distribution is a key to predicting the behavior of a sediment deposit and estimating its specific weight. A sediment sample containing a wide range of particle sizes is well graded, or poorly sorted. Conversely, a sediment sample consisting of particles in a narrow range of particle sizes is poorly graded, or well sorted.
The size distribution of sediments can be measured in several ways. The coarsest fraction can be separated by direct measurement for boulders and cobbles and by sieving for sands and gravels. For most applications involving sediments in the sand size, the visual accumulation (VA) tube is a fast, economical, and accurate method of determining the size distribution of sediment samples. In the VA tube method, the particles start falling from a common source and become stratified according to their relative settling velocities. At a given instant, the particles coming to rest at the bottom of the tube are of a certain sedimentation size, finer than particles that have already settled and coarser than those still remaining in suspension. See [19] for a description of laboratory methods for sediment analysis.
Specific Weight of Sediment Deposits
The specific weight of a sediment deposit is the dry weight of sedimentary material per unit volume. Due to the voids between sediment particles, the specific weight of a sediment deposit is always less than the specific weight of individual particles. A knowledge of the specific weight of a sediment deposit allows the conversion of sediment weights to sediment volumes and vice versa. In particular, the specific weight of a sediment deposit is useful in studies of reservoir storage depletion by deposition of fluvial sediments.
Factors influencing the specific weight of a sediment deposit are: (1) its mechanical composition, (2) the environment in which the deposits are formed, and (3) time. Coarse materials, e.g., boulders, gravel, and coarse sand, are deposited with specific weights very nearly equal to their ultimate value and change very little with time. However, fine materials such as silts and clays may have initial specific weights that are only a fraction of their ultimate value.
Lane and Koelzer [29] have developed an empirical relationship to account for the variation of the specific weight of sediment deposits in reservoirs with time. Their relationship is:
| W = W1 + B log T | (15-5) |
in which W = specific weight of the deposit after T years; W1 = initial specific weight of the deposit, measured after 1 y of consolidation; and B = a constant. Table 15-2 shows values of W1 and B as a function of sediment size and mode of reservoir operation. For mixed deposits, a weighted average of specific weight is appropriate.
| |||||||||||||||||||||||||||||||||||||||||||||||||||||||
Drying or aeration of a sediment deposit helps to accelerate consolidation through removal of the water from the pore spaces. Table 15-3 shows the effect of aeration on the specific weight of sediment deposits for several types of soil mixtures [18].
| |||||||||||||||||||||||||||||||||
Example 15-3.
Calculate the specific weight of a sediment deposit in a reservoir after an elapsed time of 50 y, with the sediment always submerged or nearly submerged.
Assume the following size distribution: sand, 30%; silt, 45%; clay, 25%.
Using Table 15-2, the specific weights for the various sizes are: sand, 93 lb/ft3; silt, 74.7 lb/ft3; clay,
Using ONLINE LANE KOELZER,
the answer for the given data is: Specific weight (total) = 75.8 lb/ft3.
|
15.2 SEDIMENT PRODUCTION
|
|
The presence of sediment in streams and rivers has its origin in soil erosion. Erosion encompasses a series of complex and interrelated natural processes that have the effect of loosening and moving away soil and rock materials under the action of water, wind, and other geologic factors. In the long term, the effect of erosion is the denudation of the land surface, i.e., the removal of soil and rock particles from exposed surfaces, their transport to lower elevations, and eventual deposition.
The rate of landscape denudation can be quantified from a geological perspective. For instance, the number of centimeters of denudation per 1000 y can be used as a measure of the erosive activity of a region. Geologic measures of landscape denudation appear insignificant when compared to the typical timespan of human activity, say 25 to 100 y. However, the quantities of sediment moved may be important when considering the impact that sediment loads have on the operation and design life of reservoirs and hydraulic structures.
At the outset of the study of sediment production, a distinction should be made between the amount of sediment eroded at the source(s) and the amount of sediment delivered to a downstream point. Gross sediment production refers to the amount of sediment eroded and removed from the source(s). Sediment yield refers to the actual delivery of eroded soil particles to a given downstream point. Since eroded particles may be deposited before they reach the downstream point of interest, sediment yield quantities are generally less than gross sediment production quantities. The ratio of sediment yield to gross sediment production is the sediment delivery ratio (SDR).
Gross sediment production is commonly measured in terms of weight of sediment per unit drainage area per unit time-for instance, metric tons per hectare per year, or tons per acre per year. Sediment yield is expressed in terms of weight per unit time past a certain point; for instance, metric tons per day at the catchment outlet.
Normal and Accelerated Erosion
According to the timespan involved, erosion may be classified as: (1) normal, or geologic, and (2) accelerated, or human-induced. Normal erosion has been occurring at variable rates since the first solid materials formed on the surface of the earth. Normal erosion is extremely slow in most places and is largely a function of climate, parent rocks, precipitation, topography, and vegetative cover. Accelerated erosion occurs at a much faster rate than normal, usually through reduction of vegetative cover. Deforestation, overgrazing, overcultivation, urban sprawl, and the systematic destruction of natural vegetation result in accelerated erosion.
Sediment Sources
According to its source, erosion may be classified as: (1) sheet erosion, (2) rill erosion, (3) gully erosion, and (4) channel erosion. Sheet erosion is the wearing away of a thin layer on the land surface, primarily by overland flow. Rill erosion is the removal of soil by small concentrations of flowing water (rills). Gully erosion is the removal of soil from incipient channels that are large enough so that they cannot be removed by normal cultivation. Channel erosion refers to erosion occurring in stream channels in the form of streambank erosion or streambed degradation. For practical purposes, a distinction is made between upland and channel erosion. Upland erosion is mostly made up of sheet and rill erosion, whereas channel erosion encompasses all other sediment sources, specifically excluding sheet and rill erosion.
Upland Erosion and the Universal Soil Loss Equation
In the United States, the prediction of upland erosion (i.e., sheet and rill erosion) is commonly made by the Universal Soil Loss Equation (USLE), developed by the USDA Agricultural Research Service in cooperation with the USDA Soil Conservation Service (now Natural Resources Conservation Service) and certain state experiment stations.
The universal soil loss equation is [46]:
| A = R K L S C P | (15-6) |
in which A = (annual) soil loss due to sheet and rill erosion in tons per acre per year: R = rainfall factor; K = soil erodibility factor; L = slope-length factor; S = slope-gradient factor; C = crop management factor; and P = erosion control practice factor.
Rainfall Factor. When factors other than rainfall are held constant, soil losses from cultivated fields are shown to be directly proportional to the product of the storm's total kinetic energy E and its maximum 30-minute intensity I. The product EI reflects the combined potential of raindrop impact and runoff turbulence to transport dislodged soil particles.
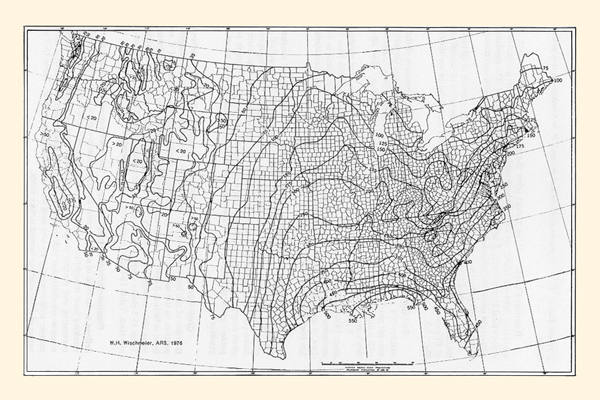
The sum of EI products for a given year is an index of the erosivity of all rainfall for that year. The rainfall factor R is the average value of the series of annual sums of EI products. Values of R applicable to the contiguous United States are shown in Fig. 15-2.
Figure 15-2 Rainfall factor R in the Universal Soil Loss Equation [44] (Click -here- to display). |
Soil Erodibility Factor. The soil erodibility factor K is a measure of the resistance of a soil surface to erosion. It is defined as the amount of soil loss (in tons per acre per year) per unit of rainfall factor R from a unit plot. A unit plot is 72.6 ft long, with a uniform lengthwise gradient of 9 percent, in continuous fallow, tilled up and down the slope.
Values of K for 23 major soils on which erosion plot studies were conducted since 1930 are listed in Table 15-4. Soil erodibility factors for other soils have been estimated by comparing their characteristics with those of the 23 soils listed in Table 15-4. A method for determining the soil erodibility factor based on soil characteristics has been proposed by Wischmeier et al. [47].
| ||||||||||||||||||||||||||||||||||||||||||||||||||||||||||||||||||||||||||||||
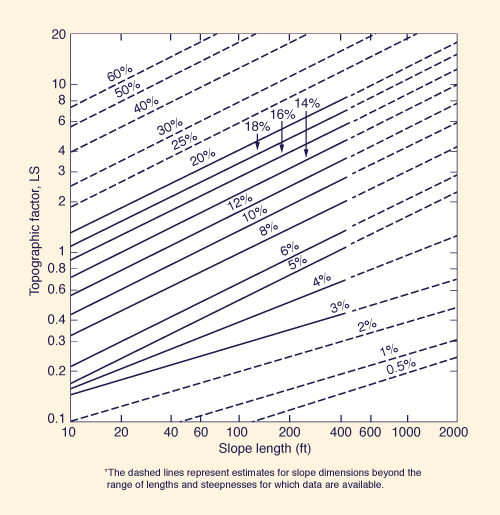
Slope-length and Slope-gradient Factors. The rate of soil erosion by flowing water is a function of slope length (L) and gradient (S). For practical purposes, these two topographic characteristics are combined into a single topographic factor (LS). The topographic factor is defined as the ratio of soil loss from a slope of given length and gradient to the soil loss from the unit plot (of 72.6 ft length and 9 percent gradient). Figure 15-3 shows values of LS as a function of slope length and gradient.
Figure 15-3 Topographic factor LS in the Universal Soil Loss Equation [44]. |
Crop-management Factor. The crop-management factor C is defined as the ratio of soil loss from a certain combination of vegetative cover and management practice to the soil loss resulting from tilled, continuous fallow. Values of C range from as little as 0.0001 for undisturbed forest land to a maximum of 1.0 for disturbed areas with no vegetation. Values of C for cropland are estimated on a local basis. Table 15-5 shows values of C for permanent pasture, grazed forest land, range, and idle land. Table 15-6 shows values of C for undisturbed forest land.
| |||||||||||||||||||||||||||||||||||||||||||||||||||||||||||||||||||||||||||||||||||||||||||||||||||||||||||||||||||||||||||||||||||||||||||||||||||||||||||||||||||||||||||||||||||||||||||||||||||||||
| ||||||||||||||||||
Erosion Control Practice Factor. The erosion control practice factor P is defined as the ratio of soil loss under a certain erosion-control practice to the soil loss resulting from straight-row farming. Practices for which P have been established are contouring and contour strip-cropping. In contour strip-cropping, strips of sod or meadow are alternated with strips of row crops or small grains. Values of P used for contour strip-cropping are also used for contour-irrigated furrows. Table 15-7 shows values of P for contour-farmed terrace fields.
| |||||||||||||||||||||||||||||||||||||||||||||||||
Use of the Universal Soil Loss Equation. The USLE computes upland erosion from small watersheds on an average annual basis. It includes the detachment and transport components, but it does not account for the deposition component. Therefore, the USLE cannot be used to compute sediment yield. For example, in a 1000-mi2 drainage basin, only 5 percent of the soil loss computed by the USLE may appear as sediment yield at the basin outlet. The remaining 95 percent is redistributed on uplands or flood plains and does not constitute a net soil loss from the drainage basin.
Example 15-4.
Assume a 600-ac watershed above a proposed floodwater-retarding structure in Fountain County, Indiana.
Compute the average annual soil loss by the universal soil loss equation for the following conditions: (1) cropland, 280 ac, contour strip-cropped, soil is Fayette silt loam, slopes are 8% and 200 ft long; (2) pasture, 170 ac, 50% canopy cover, 80% ground cover with grass, soil is Fayette silt loam, slopes are 8% and 200 ft long; and (3) forest, 150 ac, soil is Marshall silt loam, 30% tree canopy cover, slopes are 12% and 100 ft long.
From Fig. 15-2: R = 185.
From Table 15-4, K = 0.38.
From Fig. 15-3, LS = 1.4.
The value of C for cropland is obtained from local sources; assume C = 0.12 for this
example.
From Table 15-7, R = 185; K = 0.38: LS = 1.4.
From Table 15-5, C = 0.012.
No value of P has been established for pasture; therefore, P = 1.
Using Eq. 15-6: A = 185 × 0.38 × 1.4 × 0.012 × 1.0 = 1.18 tons/ac/y.
R = 185.
From Table 15-4, K = 0.33.
From Fig. 15-3, LS = 1.8.
From Table 15-6. C = 0.006.
No value of P has been established for forest.
Using Eq. 15-6: A = 185 × 0.33 × 1.5 × 0.006 × 1.0 = 0.66 tons/ac/y.
The total sheet and rill erosion from the 600-ac watershed is (280 × 2.95) + (170 × 1.18) + (150 × 0.66) = 1126 tons/y.
Using ONLINE USLE2,
the answer for the given data is: Watershed soil loss = 1126.41 tons/y.
|
Channel Erosion
Channel erosion includes gully erosion, streambank erosion, streambed degradation, floodplain scour, and other sources of sediment, excluding upland erosion. Gullies are incipient channels in process of development. Gully growth is usually accelerated by severe climatic events, improper land use, or changes in stream base levels. Most of the significant gully activity, in terms of the quantities of sediment produced and delivered to downstream locations, is found in regions of moderate to steep topography having thick soil mantles. The total sediment outflow from gullies is usually less than sheet and rill erosion [33].
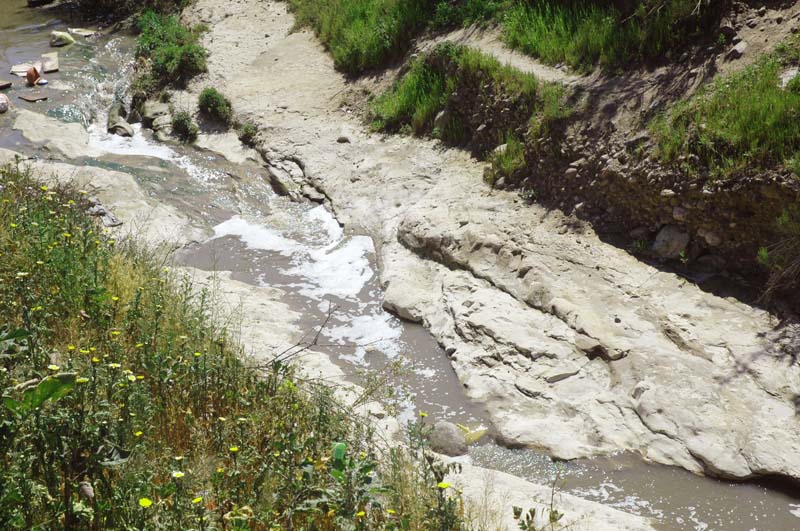
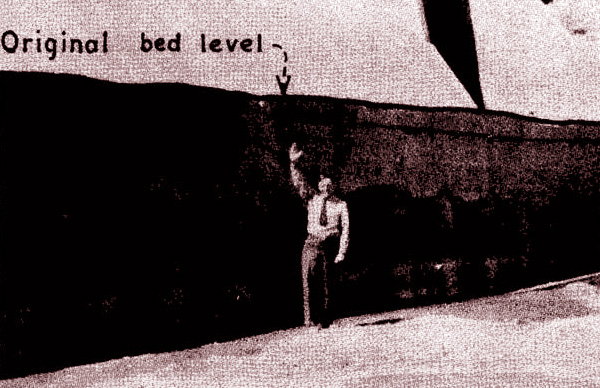
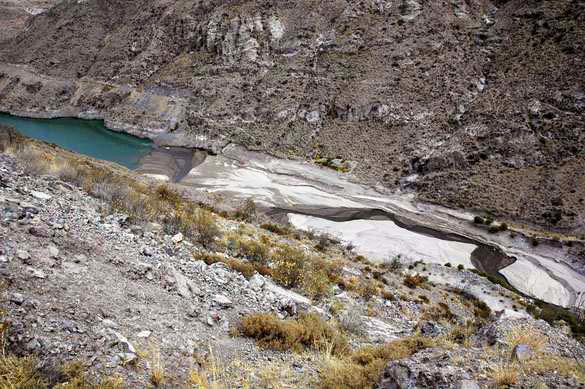
Streambank erosion and streambed degradation can be significant in certain cases. Changes in channel alignment and/or removal of natural vegetation from stream banks may cause increased bank erosion. Streambed degradation, typically downstream of reservoirs, can also constitute an additional source of sediment (Fig. 15-4).
Figure 15-4 Erosion to bedrock downstream of a sediment-retention dam. |
Methods for determining soil loss due to the various types of channel erosion include the following: (1) comparing aerial photographs taken at different times to assess the growth rate of channels, (2) performing river cross-sectional surveys to determine changes in cross-sectional area, (3) assembling historical data to determine the average age and growth rate of channels, and (4) performing field studies to evaluate the annual growth rate of channels.
Field surveys can often provide sufficient data to estimate streambank erosion as follows [44]:
| S = H L R | (15-7) |
in which S = annual volume of streambank erosion; H = average height of bank; L = length of eroded bank, each side of channel if both sides are eroding; and R = annual rate of bank recession (net rate if one side is eroding while the other is depositing).
Streambed degradation can be estimated as follows [44]:
| S = W L D | (15-8) |
in which S = annual volume of streambed degradation; W = average bottom width of degrading channel reach; L = length of degrading channel reach; and D = annual rate of streambed degradation.
Accelerated Erosion Due to Strip-mining and Construction Activities
Strip-mining and construction activities greatly accelerate erosion rates. For instance, Collier et al. [10] found that a watershed with 10.4 percent of its area strip-mined eroded 76 times more sediment than a similar undisturbed watershed. Wolman and Shick [48] found that sediment concentrations in streams draining construction areas ranged from 3000 to 150,000 ppm, compared to concentrations of 2000 ppm in comparable natural settings. These studies indicate that human-induced land disturbances have a substantial impact on sediment production. With a careful choice of factors, the USLE can be used to compute soil loss from disturbed lands.
Sediment Yield
In engineering applications, the quantity of sediment eroded at the sources is not as important as the quantity of sediment delivered to a downstream point, i.e., the sediment yield.
The sediment yield is calculated by multiplying the gross sediment production, which includes all types of erosion (sheet, rill, gully, and channel erosion) by a sediment delivery ratio that varies in the range 0 to 1 (it can also be expressed as a percentage). Therefore, a calculation of sediment yield hinges upon an estimate of gross sediment production (from the various sources) and an appropriate sediment delivery ratio.
Sediment Delivery Ratio
The sediment delivery ratio (SDR) is a function of the following factors: (1) sediment source, (2) proximity of sediment source to the fluvial transport system, (3) density and condition of the fluvial transport system, (4) sediment size and texture, and (5) catchment characteristics.
The sediment source has an influence on the delivery ratio. Not all sediments originating in sheet and rill erosion are likely to enter the fluvial transport system; however, sediments produced by channel erosion are generally closer to the transport system and are more likely to be delivered to downstream points. The proximity of the sediment source to the transport system is also an important variable in the estimation of the SDR. The amounts of sediment delivered to downstream points will depend to a large extent on the ability of the fluvial transport system to entrain and hold on to the sediment particles. Silt and clay particles can be transported much more readily than sand particles; therefore, the delivery of silts and clays is more likely to occur than that of sands. Catchment characteristics also affect sediment delivery ratios. High relief often indicates both a high erosion rate and a high SDR. High channel density is usually an indication of an efficient transport system and, consequently, of a high SDR.
Estimation of Sediment Delivery Ratios. The SDR is the ratio of sediment yield to gross sediment production. Sediment yield can be evaluated by one of several methods. At reservoir locations, estimates of sediment yield can be obtained by reservoir sedimentation surveys. Alternatively, sediment yield can be evaluated by direct measurement of sediment load at the point of interest. Estimates of gross sediment production from upland sources can be obtained using either the USLE formula or a regionally derived formula for sheet and rill erosion. When warranted, this estimate can be augmented by field estimates of gully and channel erosion.
In the absence of actual measurements, statistical analysis can be used to develop regional regression equations to predict SDR.
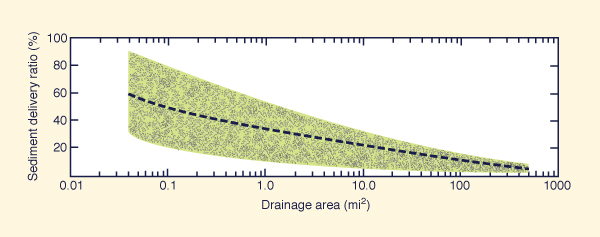
The simplest SDR prediction equation is that based solely on drainage area, as shown in Fig. 15-4.
This figure shows that SDR varies approximately in inverse proportion to the 1/5 power of the drainage area.
Other sources, however, have quoted values of this power as low as 1/8 [2].
The fact remains that the greater the drainage area, the smaller the catchment relief and the greater the chances for sediment deposition within the catchment;
consequently, the smaller the catchment's SDR.
Rough estimates of SDR can be obtained from
Figure 15-5 Relationship between sediment-delivery ratio and drainage area [44]. |
An example of the use of statistical analysis for the estimation of sediment delivery ratios is given by Roehl [37]. Using data from the southeast Piedmont region of the United States, he developed the following predictive equation:
|
L
SDR = 31,623 (10A )-0.23 (_____) -0.51 B -2.79 R | (15-9) |
in which SDR = sediment-delivery ratio, in percentage; A = drainage area, in square miles; L/R = dimensionless ratio of catchment length-to-relief (length measured parallel to main drainageway, relief measured as the elevation difference between drainage divide and outlet); and B = weighted mean bifurcation ratio, defined as the ratio of the number of streams in a given order to the number of streams in the next higher order. Values of SDR measured by Roehl in the Piedmont area were in the range 3.7 to 59.4 percent.
Empirical Formulas for Sediment Yield
As with the SDRs, statistical analysis can be used to develop regional equations for the prediction of sediment yield. A study by Dendy and Bolton [13] showed that sediment yield can be related to catchment area and mean annual runoff.
Sediment Yield versus Drainage Area. Dendy and Bolton studied sedimentation data from about 1500 reservoirs, ponds, and sediment detention basins. In developing their formulas, they used data from about 800 of these reservoirs with drainage areas greater than or equal to 1 mi2. The smaller watersheds (those of drainage area less than 1 mi2) were excluded because of their large variability of sediment yield, reflecting the diverse effects of soils, local terrain, vegetation, land use, and agricultural practices.
For drainage areas between 1 and 30,000 mi2, Dendy and Bolton found that the annual sediment yield per unit area was inversely related to the 0.16 power of the drainage area:
|
S A
____ = (_____) -0.16 SR AR | (15-10) |
in which S = sediment yield in tons per square mile per year; SR = reference sediment yield corresponding to a 1-mi2 drainage area. equal to 1645 tons per year; A = drainage area in square miles; and AR = reference drainage area (1 mi2).
Sediment Yield versus Mean Annual Runoff. Dendy and Bolton studied sedimentation data from 505 reservoirs having mean annual runoff data. Annual sediment yield per unit area was shown to increase sharply as mean annual runoff Q increased from 0 to 2 in. Thereafter, for mean annual runoff from 2 to 50 in. annual sediment yield per unit area decreased exponentially. This led to the following equations.
For Q < 2 in.:
|
S
_____ = 1.07 (Q/QR) 0.46 SR | (15-11a) |
For Q ≥ 2 in.:
|
S
_____ = 1.19 e -0.11(Q/QR) SR | (15-11b) |
in which QR = reference mean annual runoff, QR = 2 in.
Dendy and Bolton combined Eqs. 15-10 and 15-11 into a set of equations to express sediment yield in terms of drainage area and mean annual runoff.
For Q < 2 in.:
|
S Q A
_____ = 1.07 ( ______ ) 0.46 [ 1.43 - 0.26 log ( ______ ) ] SR QR AR | (15-12a) |
For Q ≥ 2 in.:
|
S A
_____ = 1.19e -0.11(Q/QR) [ 1.43 - 0.26 log ( ______ ) ] SR AR | (15-12b) |
For SR = 1645 tons/mi2/y, QR = 2 in., and AR = 1 mi2, Eq. 15-12 reduces to the following:
For Q < 2 in.:
| S = 1280 Q 0.46 (1.43 - 0.26 log A) | (15-13a) |
For Q ≥ 2 in.:
| S = 1965 e -0.055Q (1.43 - 0.26 log A) | (15-13b) |
Equations 5-12 and 5-13 are based on average values of grouped data; therefore, they should be used with caution. In certain cases, local factors such as soils, geology, topography, land use, and vegetation may have a greater influence on sediment yield than either mean annual runoff or drainage area. Nevertheless, these equations provide a first approximation to the regional assessment of sediment yield for watershed planning purposes.
Example 15-5.
Calculate the sediment yield by the Dendy and Bolton formula for a 150-mi2 watershed with 3.5 in. of mean annual runoff.
The application of Eq. l5-13b leads to:
Therefore, the sediment yield is 210,123 ton/y.
Using ONLINE DENDY-BOLTON,
the answer for the given data is: Sediment yield = 210,123 tons/y.
|
Other widely used sediment yield prediction formulas are the modified universal soil loss equation (MUSLE), developed by Williams [45], and the Flaxman formula [17]. Unlike the USLE, which is based on annual values, the MUSLE is intended for use with individual storms. The Flaxman formula was developed using data from the western United States and is therefore particularly applicable to that region.
15.3 SEDIMENT TRANSPORT
|
|
Sediment transport refers to the entraInment and movement of sediment by flowing water. An understanding of the principles of sediment transport is essential for the interpretation and solution of many hydraulic, hydrologic, and water resources engineering problems.
The study of sediment transport can be divided into: (1) sediment transport mechanics, (2) sediment transport prediction, and (3) sediment routing. Sediment transport mechanics refers to the fundamental processes by which sediment is entrained and transported by flowing water. Sediment transport prediction refers to the methods and techniques to predict the equilibrium or steady rate of sediment transport in streams and rivers. The prediction of sediment transport is accomplished by means of a sediment transport formula. Sediment routing refers to the nonequilibrium or unsteady sediment transport processes, the net result of which is either the aggradation or degradation of stream and river beds.
The description of sediment transport is based on principles of fluid mechanics, river mechanics, and fluvial geomorphology. The energy and turbulence of the flow gives streams and rivers the capacity to entrain and transport sediment. The sediment being transported can originate in either: (a) upland sources or (b) channel sources.
A significant feature of sediment transport is the entrainment and transport by the flow of the material constituting the channel bed. Thus, sediment transport serves not only as the means for the movement of sediment from upstream to downstream but also as the mechanism by which streams and rivers determine their own cross-sectional shape and boundary roughness. While the transport of sediment is a fluid mechanics subject, the interaction between flowing stream and its boundary is a river mechanics subject.
Sediment Transport Mechanics
Sediment load or sediment discharge is the total amount of sediment transported by a stream or river past a given point, expressed in terms of weight per unit time. Based on the predominant mode of transport, sediment load can be classified into: (a) bed load and (b) suspended load. Bed load is the fraction of sediment load that moves by saltation and rolling along the channel bed, primarily by action of bottom shear stresses caused by vertical velocity gradients. Suspended load is the fraction of sediment load that moves in suspension by the action of turbulence. Particles transported as bed load are coarser than particles transported as suspended load. However, the distinction between bed load and suspended load is not all-exclusive; some particles may move as bed load at one point, as suspended load at another, and vice versa.
Based on whether the particle sizes are represented in the channel bed, sediment load can be classified into: (a) bed-material load and (b) fine-material load. Bed-material load is the fraction of sediment load whose particle sizes are significantly represented in the channel bed. Conversely, fine-material load (commonly referred to as wash load) is the fraction of sediment load whose particle sizes are not significantly represented in the channel bed. Stated in other terms, bed-material load is the coarser fraction of sediment load that may have originated in the channel bed and that may be subject to deposition under certain flow conditions. Wash load is the finer fraction of sediment load that has not originated in the channel bed and that is not likely to deposit. Wash load is then, washed through the reach, largely unaffected by the hydraulics of the flow.
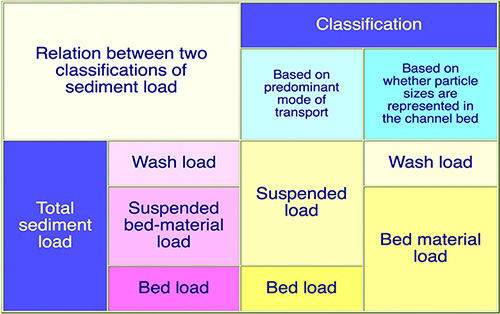
The relationship between the two classifications of sediment load is shown in Fig. 15-6 [11]. This figure shows that the concepts of bed load and wash load are mutually exclusive. The middle overlap is the suspended bed-material load, i.e., the fraction of sediment load that moves in suspended mode and is composed of particle sizes that are represented in the channel bed.
Figure 15-6 Relationship between the two classifications of sediment load [11]. |
Initiation of Motion. Water flowing over a streambed has a marked vertical velocity gradient near the streambed. This velocity gradient exerts a shear stress on the particles lying on the streambed, i.e., a bottom shear stress. For wide channels, the bottom shear stress can be approximated by the following formula [5]:
| τo = γ d So | (15-14) |
in which τo = bottom shear stress; γ = specific weight of water; d = flow depth; and So = equilibrium or energy slope.
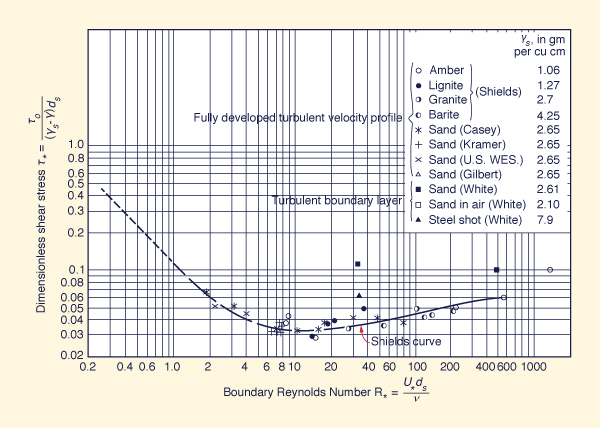
There is a threshold value of bottom shear stress above which the particles actually begin to move. This threshold value is referred to as critical bottom shear stress, or critical tractive stress. Determinations of critical tractive stress for given flow and sediment conditions are largely empirical in nature. The Shields curve, shown in Fig. 15-7, represents the earliest attempt to combine theoretical and empirical approaches to estimate critical tractive stress [2]. The Shields curve depicts the threshold of motion, i.e., the condition separating motion (above the curve) from no motion (below the curve) [39].
Figure 15-7 Shields diagram for initiation of motion [2]. |
The abscissa in the Shields diagram is the boundary Reynolds number, defined as:
|
U *ds
R* = _______ ν | (15-15) |
in which R* = boundary Reynolds number; U* = shear velocity; ds = mean particle diameter; and v = kinematic viscosity of water. The shear velocity is defined as follows:
|
τo
U* = (____)1/2 ρ | (15-16) |
in which ρ = density of water. The ordinate in the Shields diagram is the dimensionless tractive stress, defined as follows:
|
τo
τ* = ____________ (γs - γ) ds | (15-17) |
in which τ* = dimensionless tractive stress.
The Shields diagram indicates that, within a midrange of boundary Reynolds numbers (approximately 2-200), the dimensionless critical tractive stress can be taken as a constant for practical purposes. Therefore, within this range, the critical tractive stress is proportional to the sediment particle size. For instance, assuming a value of dimensionless critical tractive stress τ* = 0.04 (from the Shields diagram, Fig. 15-7), Eq. 15-17 leads to:
| τc = 0.04 (γs - γ) ds | (15-18) |
in which τc = critical tractive stress. For quartz particles (γs = 2.65 × 62.4 lb/ft3), Eq. 15-18 reduces to:
| τc = 0.34 ds | (15-19) |
in which critical tractive stress is given in pounds per square foot and particle diameter in inches. Extensive experimental studies by Lane [30] have shown that the coefficient in Eq. 15-19 is around 0.5. Lane, however, used the d75 particle size (i.e., the diameter for which 75% by weight is finer) instead of the mean diameter (d50) used by Shields.
Example 15-6.
Based on the Shields criterion for initiation of motion, determine whether a 3-mm diameter quartz particle is at rest or moving under the action of a 7-ft flow depth with channel slope S0 = 0.0001.
Assume water temperature 70°F.
From Eq. 15-14, the bottom shear stress is: τo = 62.4 × 7 × 0.0001 = 0.0437 lb/ft2.
From Eq. 15-17, the dimensionless tractive stress is: τ* = 0.0437/ [(2.65 - 1.0) ×
62.4 × 3 / (25.4 × 12)] = 0.0431.
From Eq. 15-16, the shear velocity is: U* = (0.0437 / 1.94)1/2 = 0.15 ft/s.
From Table A-2, the kinematic viscosity is: 1.058 x 10⁻⁵ ft2/ s.
From Eq. 15-15, the boundary Reynolds number is: R* = 0.15 × [3 / (25.4 × 12)] / (1.058 × 10⁻⁵) = 140.
For R* = 140, the dimensionless critical tractive stress is obtained from the Shields curve (Fig. 15-7): τ*c= 0.048.
Since τ* = 0.0431 is less than τ*c = 0.048, it is concluded that the particle is at rest.
Using ONLINE SHIELDS,
the answer for the given data is: No movement. The particle is at rest.
|
Forms of Bed Roughness. Streams and rivers create their own geometry. In particular, alluvial rivers determine to a large extent their cross-sectional shape and boundary friction as a function of the prevailing water and sediment discharge. An inherent property of river flows is their tendency to minimize changes in stage caused by changes in discharge. This is accomplished through a continuous adjustment in boundary friction in such a way that high values of friction prevail during low flows, while low values of friction prevail during high flows [27].
Bed forms are three-dimensional configurations of bed material, which are formed in streambeds by the action of flowing water. Adjustments in boundary friction are made possible by the existence of these bed forms, which develop during low flows (lower flow regime) only to be obliterated during high flows (upper flow regime) [40]. Boundary friction consists of two parts: (1) grain roughness and (2) form roughness. Grain roughness is a function of particle size; form roughness is a function of size and extent of bed forms. Grain roughness is essentially a constant when compared to the variation in form roughness that can be attributed to bed forms.
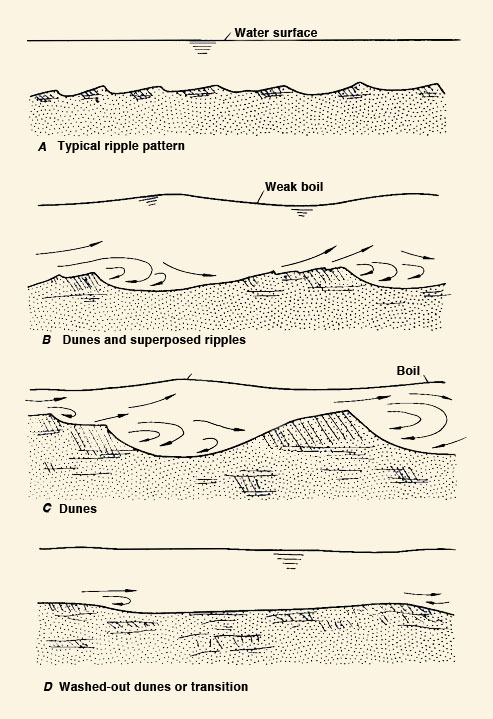
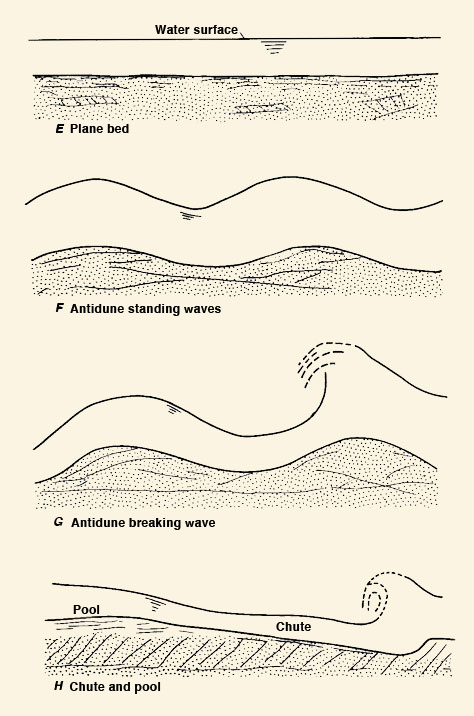
Studies have shown that several forms of bed roughness can exist on river bottoms, depending on the energy and bed-material transport capacity of the flow. In the absence of sediment movement, the bed configuration is that of plane bed with no sediment motion. With sediment movement, the following forms of bed roughness have been identified: (a) ripples, (b) dunes and superposed ripples, (c) dunes, (d) washed-out dunes or transition, (e) plane bed with sediment motion, (f) antidune standing waves, (g) antidune breaking waves, and (h) chutes and pools. Sketches of these bed configurations are shown in Fig. 15-8 [40].
|
|
|
Figure 15-8 Forms of bed roughness in alluvial channels [40].
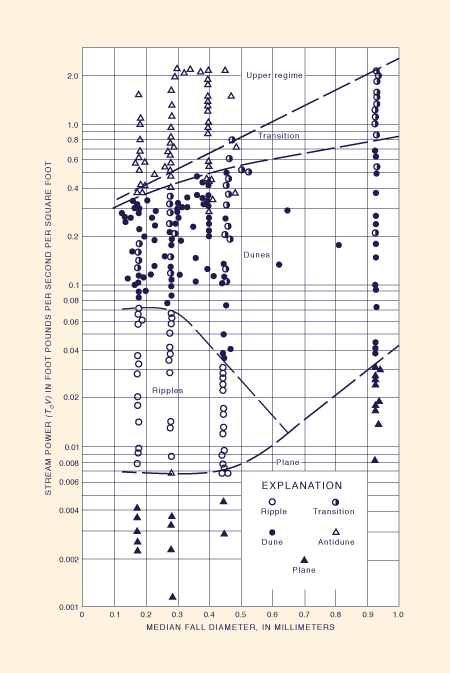
The occurrence of different forms of bed roughness can be shown to be related to the median fall diameter of the particles forming the bed and to the stream power of the flow.
Stream power is defined as the product of bottom shear stress and mean velocity.
Such a relationship is shown in
The plane bed with sediment motion represents the condition at which the flow's stream power is large enough to obliterate the dunes, essentially eliminating the form roughness. The plane bed, then, represents the condition of minimum boundary friction. For high values of stream power, antidunes (upper regime) form in conjunction with surface waves, with the tendency for upstream movement, usually under supercritical flow conditions. For even higher values of stream power, e.g., in very steep streams, the bed configuration resembles a sequence of chutes and pools [40].
Figure 15-9 Form of bed roughness versus stream power |
The assessment of bedform type has practical implications for engineering hydrology. Bedforms determine boundary roughness; in turn, boundary roughness determines river stages. For instance, ripples are associated with values of Manning n in the range 0.018 to 0.030, with form roughness usually a fraction of grain roughness. Dunes, however, are associated with n values in the range 0.020 to 0.040, with form roughness of the same order as grain roughness. Moreover, plane bed with sediment motion is associated with relatively low n values, in the range 0.012 to 0.015, and in this case, form roughness is minimal.
The proper assessment of boundary friction, including its variation as the flow changes from lower regime (ripples, ripples on dunes, and dunes) to upper regime (plane bed with sediment movement, antidunes, and chutes and pools) is an important subject in engineering hydrology and fluvial hydraulics.
Concentration of Suspended Sediment. For a given volume of water-sediment mixture, the suspended-sediment concentration is the ratio of the weight of dry sediment to the weight of the water-sediment mixture, expressed in parts per million. To convert the concentration in ppm to milligrams per liter (mg/ L), the applicable factor ranges from 1.0 for concentrations between 0 and 15,900 ppm, to 1.5 for concentrations between 529,000 and 542,000 ppm, as shown in Table 15-8.
| ||||||||||||||||||||||||||||||||||||||||||||||||||||||||||||
The suspended-sediment concentration varies with the flow depth, usually being higher near the stream bed and lower near the water surface. The coarsest sediment fractions, typically those in the sand size, exhibit the greatest variation in concentration with flow depth. The finer fractions, i.e., silt and clay particles, show a tendency for a nearly uniform distribution of suspended-sediment concentration with flow depth.
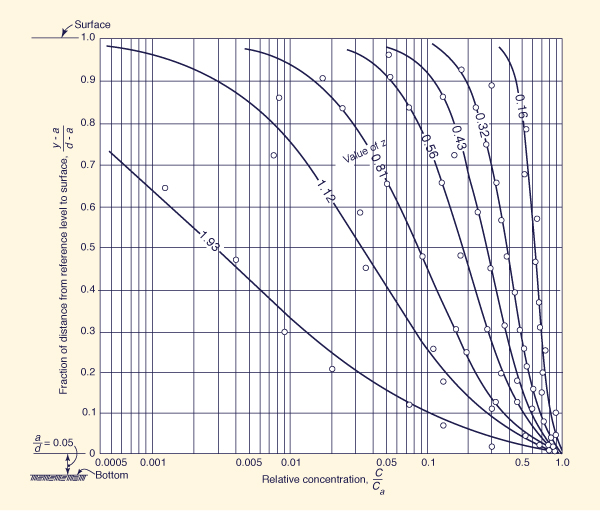
Figure 15-10 shows the variation of suspended-sediment concentration along the flow depth. In this figure, y is the fraction of flow depth measured from the channel bottom, a is the reference distance measured from the channel bottom, and d is the flow depth. The abscissas show the dimensionless ratio C/Ca, in which Ca is the sediment concentration at the reference distance and C is the sediment concentration at a distance (y - a). The value of a is small compared to d. The plot of Fig. 15-10 is specifically for the case of a/d = 0.05. The ordinates show the dimensionless ratio (y - a)/(d - a). The curve parameter z is the Rouse number, defined as follows:
|
w
z = _________ β κ U* | (15-20) |
in which z = Rouse number (dimensionless); w = fall velocity of sediment particles; β = a coefficient relating mass and momentum transfer (β ≅ 1 for fine sediments); κ = von Karman's constant (κ = 0.4 for clear fluids); and U* = shear velocity, Eq. 15-16. From Fig. 15-10, it is seen that for high Rouse numbers the variation of suspended sediment concentration along the flow depth is quite marked. Conversely, for low Rouse numbers there is a tendency for greater uniformity of suspended-sediment concentration along the flow depth.
Figure 15-10 Variation of suspended sediment concentration along the flow depth [2]. |
Sediment Transport Prediction
Sediment load, sediment discharge, and sediment transport rate are synonymous in practice. However, bed load, suspended bed-material load, and wash load are mutually exclusive. Sediment transport prediction refers to the estimation of sediment transport rates under equilibrium (i.e., steady uniform) flow conditions.
There are numerous formulas for the prediction of sediment transport [2]. Most formulas compute only bed-material load, consisting of bed load and suspended bed-material load. A few compute total sediment load, which consists of bed load, suspended bed-material load, and wash load. Yet some may compute bed load and suspended bed-material load separately. Invariably, sediment transport formulas have some empirical components and, therefore, are most applicable within the range of laboratory and/ or field data used in their development.
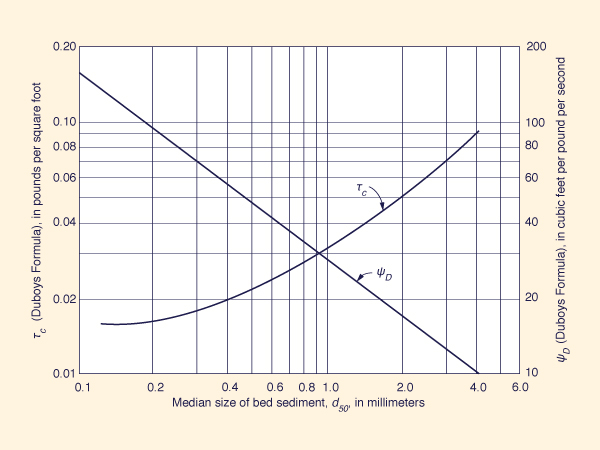
Duboys Formula. The Duboys formula is widely recognized as one of the earliest attempts to develop a sediment transport predictor. The Duboys formula is [14]:
| qs = ψD τo ( τo - τc ) | (15-21) |
in which qs = bed-material transport rate per unit of channel width, in pounds per second per foot;
Figure 15-11 Values of ψD and τc for use in the Duboys equation [2]. |
Example 15-7.
Given a channel of mean flow depth d = 12 ft, mean width b = 320 ft; equilibrium channel slope So = 0.0001, and median particle size d50 = 0.6 mm, calculate the bed-material transport rate by the Duboys formula.
Using Eq. 15-14: τo = 62.4 × 12.0 × 0.0001 = 0.07488 lb/ft2.
From Fig. 15-11: ψD = 42 ft3/lb/s.
From Fig. 15-11:
τc = 0.025 lb/ft2.
From Eq. 15-21: qs = 42 × 0.07488 × (0.07488 - 0.025) = 0.157 lb/s/ft.
Therefore: Qs = qs b = 0.157 × 320 = 50.2 lb/s.
Using ONLINE DUBOYS,
the answer is: Qs = 50.551 lb/s, which is equivalent to 2,183.821 tons/day.
|
Meyer-Peter Formula. The development of the Meyer-Peter formula was based on flume data, with uniform bed material size in the range 3 to 28 mm. Such coarse sediments do not produce appreciable bed forms; therefore. the formula is applicable to coarse sediment transport where form roughness is negligible. The Meyer-Peter formula is [2, 35]:
| qs = ( 39.25 q 2/3 So - 9.95 d50 ) 3/2 | (15-22) |
in which qs = bed-material transport rate per unit channel width, in pounds per second per foot; q = water discharge per unit channel width, in cubic feet per second per foot; So = equilibrium channel slope; and d50 = median particle size, in feet.
Example 15-8.
Given a channel of mean flow depth d = 2 ft; mean width b = 25 ft; mean velocity v = 6 fps; channel slope
The discharge per unit width is: q = vd = 6 x 2 = 12 ft3/s/ft.
From Eq. 15-22: qs = { ( 39.25 x 12 2/3 x 0.008 ) - [ 9.95 x 22 / (25.4 x 12) ] } 3/2 = 0.894 lb/s/ft.
Therefore: Qs = qs b = 22.35 lb/s.
Using ONLINE MEYER-PETER,
the answer is: Qs = 22.337 lb/s, which is equivalent to 964.941 tons/day.
|
Einstein Bed-load Function. In 1950, Einstein published a procedure for the computation of bed material transport rate by size fractions [15]. The method was developed based on theoretical considerations of turbulent flow, supported by laboratory and field data. Einstein is credited with the introduction of several novel concepts in sediment transport theory, including the separation of boundary friction into grain and form roughness and the use of statistical properties of turbulence to explain the mechanics of sediment transport.
Einstein's bed-load function first computes the bed-load transport rate. Then it uses the bed-load transport rate to aid in the integration of the product of the suspended sediment concentration profile and the flow velocity profile, to determine the suspended bed-material transport rate, per individual size fraction. Several step-by-step procedures have been reported in the literature [2].
Modified Einstein Procedure. The modified Einstein procedure was developed by Colby and Hembree [6] in order to include actual measurements of suspended load into the framework of the original Einstein method.
Typically, measurements of suspended load do not include: (a) the bed load, and (b) the fraction of suspended load moving too close to the streambed to be effectively sampled.
The modified Einstein procedure calculates the total sediment load by size fractions based on measurements of suspended load and relevant geometric and hydraulic characteristics of the stream or river.
Details of the method are reported in the literature [2, 6].
Colby's 1957 Method. Colby's 1957 method is based on some of the same measurements that led to the development of the modified Einstein procedure. However, unlike the latter, it does not account for sediment transport rate by size fractions. Instead, it provides the total bed-material discharge, i.e., the sum of measured and unmeasured bed-material discharges.
The following data are needed in an application of the Colby 1957 method: (1) mean flow depth d, (2) mean channel width b, (3) mean velocity v, and (4) measured concentration of suspended bed-material discharge Cm. The procedure is as follows [7]:
Use Fig. 15-12 to obtain the uncorrected unmeasured sediment discharge qu' (in tons per day per foot of width) as a function of mean velocity.
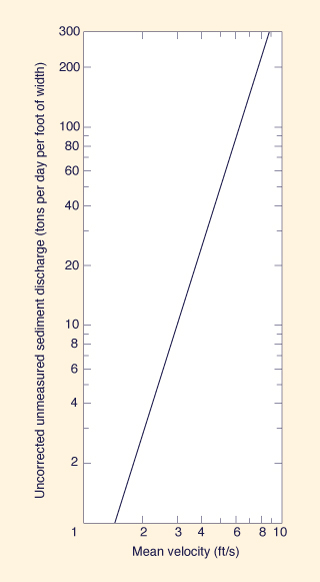
Figure 15-12 Uncorrected unmeasured sediment discharge
versus mean velocity in Colby 1957 method [7].Use Fig. 15-13 to obtain the relative concentration of suspended sands Cr (in parts per million) as a function of mean velocity and flow depth.
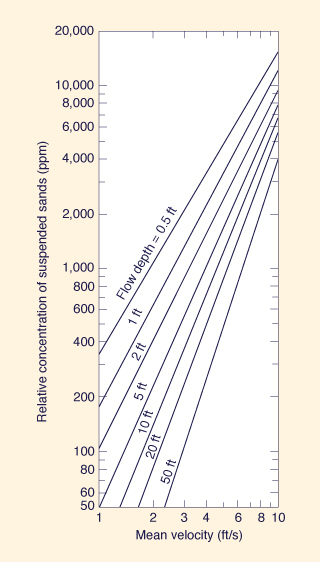
Figure 15-13 Relative concentration of suspended sands
versus mean velocity and flow depth
in Colby 1957 method [7].Calculate the availability ratio by dividing the measured concentration of suspended bed-material discharge Cm (ppm) by the relative concentration of suspended sands Cr (ppm).
Use the mean line of Fig. 15-14 and the availability ratio to obtain the correction factor C to be multiplied by the uncorrected unmeasured sediment discharge qu' to obtain the unmeasured sediment discharge qu (in tons per day per foot).
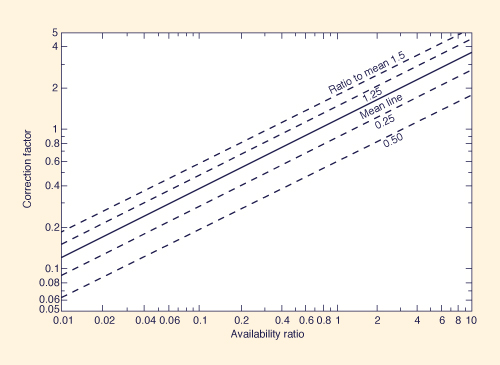
Figure 15-14 Correction factor versus availability ratio in Colby 1957 method [7].
The total bed-material discharge qs is the sum of measured and unmeasured sediment discharges:
qs = 0.0027 Cm q + qu (15-23)
in which qs = bed-material discharge in tons per day per foot; q = water discharge in cubic feet per second per foot; Cm = measured concentration of suspended bed-material discharge in milligrams per liter; and 0.0027 is the conversion factor for the indicated units. Table 15-8 shows a factor to convert concentration in parts per million to milligrams per liter.
Example 15-9.
Given mean flow depth d = 10 ft, mean channel width b = 300 ft, mean velocity v = 3 fps, measured concentration of suspended bed material discharge Cm = 100 ppm, calculate the total bed material discharge by the Colby 1957 method.
From Fig. 15-12 , the uncorrected unmeasured sediment discharge is qu' = 10 ton/d/ft.
From Fig. 15-13, the relative concentration of suspended sands is Cr = 380 ppm.
The availability ratio is: 100/380 = 0.27.
From Fig. 15-14, the correction factor is C = 0.6.
Therefore: qu = 0.6 × 10 = 6 ton/d/ft.
The water discharge per unit width is: q = vd = 3 x 10 = 30 ft3/s/ft.
From Eq. 15-23, the sediment discharge per unit width is: qs = (0.0027 × 100 × 30) + 6 = 14.1 ton/d/ft.
Therefore, the bed-material discharge by the Colby 1957 method is: Qs = qs b = 14.1 × 300 = 4230 ton/d.
Using ONLINE COLBY 1957,
the answer is: Qs = 4,231.15 tons/day.
|
Colby's 1964 Method. In 1964, Colby published a method to calculate discharge of sands (i.e., bed-material discharge) in sand-bed streams and rivers. The development of the method was guided by the Einstein bed-load function and supported by large amounts of laboratory and field data. The method has been shown to provide a reasonably good prediction of sediment transport rates, particularly for sand-sized particles.
The following data are needed: (1) mean flow depth d, (2) mean channel width b, (3) mean velocity v, (4) water temperature T, (5) concentration of fine-material load (i.e., wash load) Cw, and (6) median size of bed material d50. The procedure is as follows [8]:
-
Use Fig. 15-15 to determine the uncorrected discharge of sands qu (in tons per day per foot of width) as a function of mean velocity, flow depth, and sediment size.
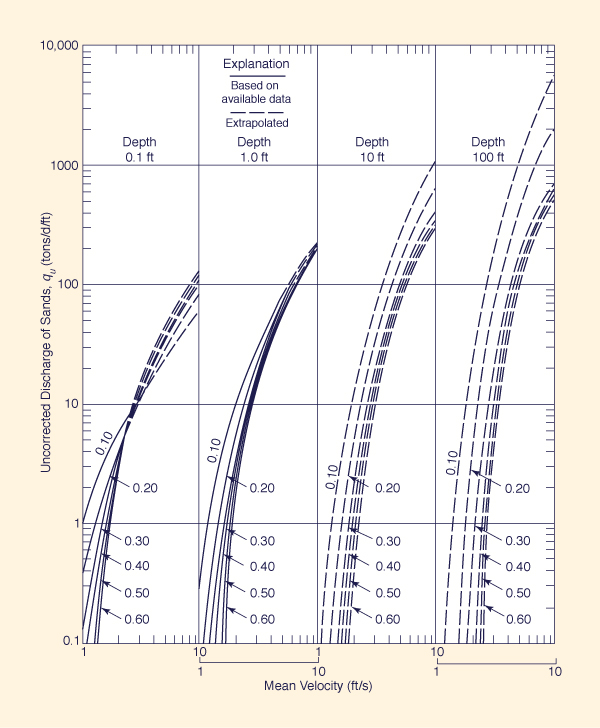
Figure 15-15 Discharge of sands as a function of mean velocity, flow depth and sediment size [9].
-
For water temperature of 60°F, negligible wash load concentration (less than 1000 ppm), and sediment size in the range 0.2 to 0.3 mm, no further calculations are required, and qu is the discharge of sands qs.
-
For conditions other than the preceding, use Fig. 15-16 to obtain the correction factor k1 as a function of flow depth and water temperature, k2 as a function of flow depth and concentration of fine-material load, and k3 as a function of median size of bed material.
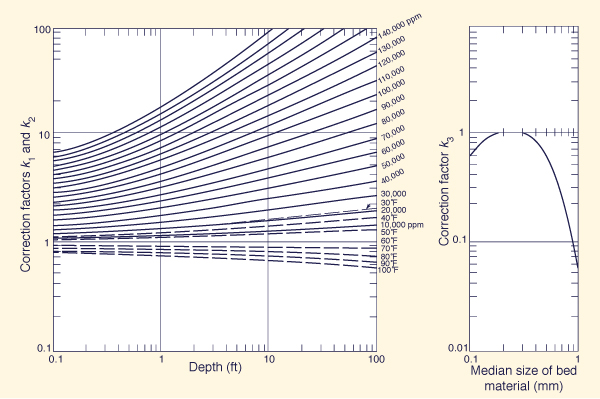
Figure 15-16 Correction factors for water temperature (k1), fine-material-load concentration (k2),
and median size of bed material (k3) [9]. -
The discharge of sands is given by the following formula:
qs = [ 1 + (k1k2 - 1) k3 ] qu (15-24) in which qs discharge of sands in tons per day per foot.
Example 15-10.
Given mean flow depth d = 1 ft, mean channel width b = 30 ft, mean velocity v = 2 fps, water temperature 50°F, wash-load concentration Cw = 10,000 ppm, and median bed-material size d50 = 0.1 mm.
Calculate the discharge of sands by the Colby 1964 method.
From Fig. 15-14: qu = 9 ton/d/ft.
From Fig. 15-15: k1 = 1.14, k2 = 1.22, k3 = 0.6.
From Eq. 15-24: qs = [ 1 + (1.14 × 1.22 - 1) × 0.6 ] × 9 = 11.11 ton/d/ft.
Therefore, the discharge of sands is: Qs = 11.11 × 30 = 333.3 ton/d.
Using ONLINE COLBY,
the answer is: Qs = 333.31 tons/day.
|
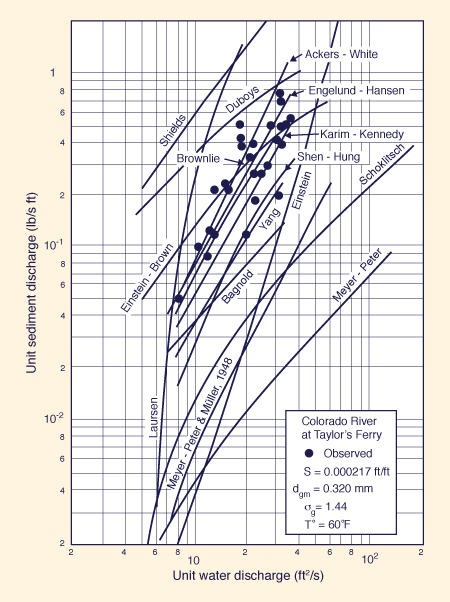
Other Methods for the Calculation of Sediment Discharge. Many other methods have been proposed for the calculation of sediment discharge. Notable among them are the methods of Ackers and White [1], Engelund-Hansen [16], Toffaleti [42], and Yang [49]. The various procedures vary in complexity and range of applicability. For details on these and other sediment transport formulas, see [2, 4, 25, 41].
Figure 15-17
Comparison of various formulas |
Sediment Rating Curves
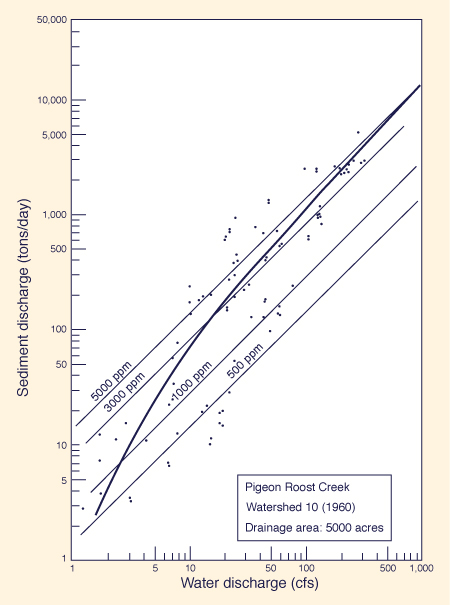
A useful curve in sediment analysis is the sediment rating curve, defined as the relationship between water discharge and sediment discharge at a given gaging site (Fig. 15-17). For a given water discharge, the sediment rating curve allows the estimation of sediment discharge, assuming steady equilibrium flow conditions.
The sediment rating curve is an x-y plot showing water discharge in the abscissas and sediment discharge in the ordinates. This plot is obtained either by the simultaneous measurement of water and sediment discharge or, alternatively, by the use of sediment transport formulas. For low-water discharges, the sediment rating curve usually plots as a straight line on logarithmic paper, showing an increase of sediment concentration with water discharge. However, for high water discharges, the sediment rating curve has a tendency to curve slightly downward, approaching a line of equal sediment concentration (i.e., a line having a 45° slope in the x-y plane) (Fig. 5-18).
Figure 15-18 Typical sediment rating curve [2]. |
Like the single-valued stage-discharge rating, the single-valued sediment rating curve is strictly valid only for steady equilibrium flow conditions. For strongly unsteady flows, the existence of loops in both water and sediment rating curves has been demonstrated [2]. These loops are complex in nature and are likely to vary from flood to flood. In practice, loops in water and sediment rating are commonly disregarded.
Sediment Routing
The calculation of sediment yield is lumped, i.e., it does not provide a measure of the spatial or temporal variability of sediment production within the catchment. Sediment transport formulas are invariably based on the assumption of steady equilibrium flow. Sediment routing, on the other hand, refers to the distributed and unsteady calculation of sediment production, transport and deposition in catchments, streams, rivers, reservoirs, and estuaries.
Of necessity, sediment routing involves a large number of calculations and, therefore, it is ideally suited for use with a computer. Sediment routing should be used, in addition to sediment yield and sediment transport evaluations, in cases where the description of spatial and temporal variations of sediment production, transport, and deposition is warranted. Sediment routing methods are particularly useful in the detailed analysis of sediment transport and deposition in rivers and reservoirs. For example, the computer model HEC-RAS, "River Analysis System," has a sediment routing component [21]. Several other sediment routing models have been developed in the last two decades; see, for instance, [4] and [25].
The Lane Relation
Lane [31] pioneered the development of quantitative fluvial geomorphology by relating water and sediment discharge to the stream slope and mean particle diameter. The Lane relation is:
| Qs ds ∝ Qw So | (15-25) |
which states the proportionality between the product of sediment discharge and sediment particle diameter (Qs ds) and the product of water discharge and stream slope (Qw So). The Lane relation is dimensional and was derived from experience.
Ponce [36] has improved the Lane relation by expressing it in dimensionless form, as follows:
| Qs (ds/R)1/3 ∝ γ Qw So | (15-26) |
in which R = hydraulic radius, and γ = specific weight of water. In Eq. 15-26, Qs is given in [F T-1] units, ds and R in the same units [L], γ in [F L-3] units, Qw in [L3 T-1] units, and So is dimensionless.
The general unit-width sediment discharge is [36]:
| qs = ρ k1 v m | (15-27) |
in which k1 and m are coefficient and exponent, respectively, of the unit-width sediment discharge vs mean velocity relation. For the special case of m = 3, Eq. 15-27 reduces to:
| qs = ρ k1 v 3 | (15-28) |
in which k1 is dimensionless.
For m = 3, Eq. 15-26 reduces to the sediment transport relation [36]:
| Qs = 58.7 k1 γ Qw So (R/ds)1/3 | (15-29) |
Equation 5-29 is dimensionless; therefore, independent of the system of units.
Applications. Assume pre- and post-development conditions, with subscripts 1 and 2, respectively. Further define the ratios: a = Qs2/Qs1; b = ds2/ds1; c = R2/R1; d = Qw2/Qw1; and e = So2/So1.
From Eq. 15-26:
| a (b/c)1/3 = d e | (15-30) |
Thus, the stream slope change from pre- to post-development is (Fig. 15-19):
| e = (a/d) (b/c)1/3 | (15-31) |
Figure 15-19 Streambed degradation below Fort Sumner Dam, Pecos river, New Mexico [31]. |
Example 15-11.
A river reach downstream of a proposed
dam has the following pre- and post-development conditions: a = 0.3, b = 1.0, c = 0.95, and d = 0.9.
Calculate the ratio of post- to pre-development stream slope.
Using Eq. 15-31: e = (0.3/0.9)(1.0/0.95)1/3 = 0.34. This assumes
the absence of geologic control or armoring,
which, if present, would increase the value of e above 0.34.
|
15.4 SEDIMENT DEPOSITION IN RESERVOIRS
|
|
The concepts of sediment yield and sediment transport are essential to the study of sediment deposition in reservoirs. Sediment is first produced at upland and channel sources and then transported downstream by the action of flowing water. If the flowing water is temporarily detained, as in the case of an instream reservoir, its ability to continue to entrain sediment is substantially impaired, and deposition takes place.
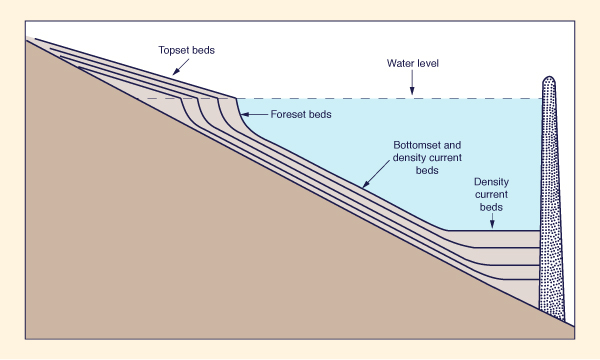
Sediment deposition occurs in the vicinity of reservoirs. typically as shown in Fig. 15-20 [20]. First, deposition of the coarser-size fractions takes place near the entrance to the reservoir. As water continues to flow into the reservoir and over the dam, the delta continues to grow in the direction of the dam until it eventually fills the entire reservoir volume. The process is quite slow but relentless. Typically, reservoirs may take 50 to 100 y to fill, and in some instances, up to 500 y or more.
Figure 15-20 Longitudinal sedimentation patterns in a reservoir operating at constant water level [20]. |
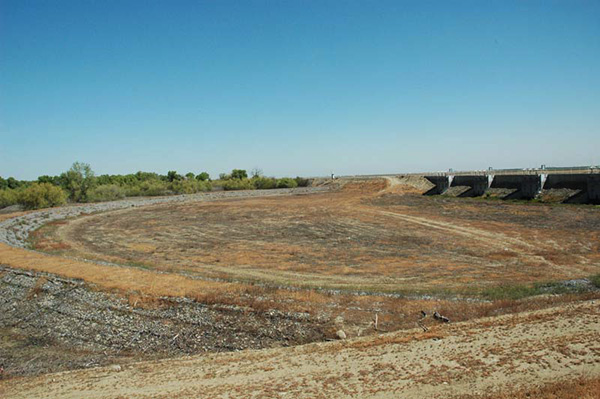
The rate of sediment deposition in reservoirs is a matter of considerable economic and practical importance. Since reservoirs are key features of hydroelectric and water resources development projects, the question of the design life of a reservoir is appropriate, given that most reservoirs will eventually fill with sediment. In an extreme example, the filling can occur in a single storm event, as in the case of a small sediment detention basin located in a semiarid region (Fig. 15-21). On the other hand, the reservoir can take hundreds of years to fill, as in the case of a large reservoir located in a predominantly humid or subhumid environment.
Figure 15-21 Sediment detention basin at the confluence of Arroyo Pasajero |
Reservoir Trap Efficiency
The difference between incoming and outgoing sediment is the sediment deposited in the reservoir. The incoming sediment can be quantified by the sediment yield, i.e. , the total sediment load entering the reservoir. The outgoing sediment can be quantified by the trap efficiency. Trap efficiency refers to the ability of the reservoir to entrap sediment being transported by the flowing water. It is defined as the ratio of trapped sediment to incoming sediment, in percentage, and is a function of: (1) the ratio of reservoir volume to mean annual runoff volume, and (2) the sediment characteristics.
The following procedure is used to determine trap efficiency [44]:
-
Determine the reservoir capacity C in cubic hectometers (106 cubic meters) or acre-feet.
-
Determine the mean annual inflow I to the reservoir (runoff volume), in cubic hectometers or acre-feet.
-
Use Fig. 15-22 to determine the percentage trap efficiency as a function of the ratio C/I for any of three sediment characteristics. Estimate the texture of the incoming sediment by a study of sediment sources and/ or sediment transport by size fractions. The upper curve of Fig. 15-21 is applicable to coarse sands or flocculated sediments; the middle curve, to sediments consisting of a wide range of particle sizes; and the lower curve, to fine silts and clays.
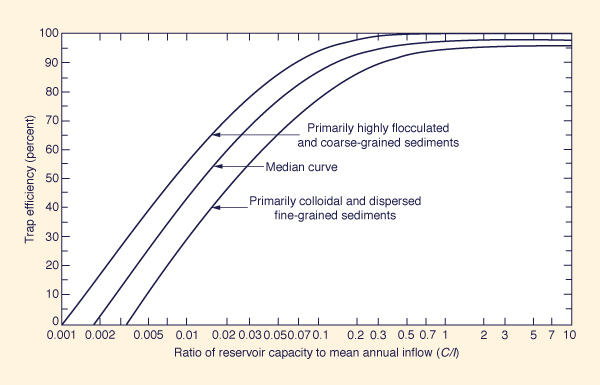
Figure 15-22 Trap efficiency versus capacity-to-inflow ratio [44].
Reservoir Design Life
The design life of a reservoir is the period required for the reservoir to fulfill its intended purpose. For instance, structures designed by the Soil Conservation Service for watershed protection and flood prevention programs have a design life of 50 to 100 y. Due to reservoir sedimentation, provisions are made to guarantee the full-design reservoir water-storage capacity for the planned design life. This may entail either: (1) cleaning out reservoir sediment deposits at predetermined intervals during the life of the structure or, as is more often the case, (2) providing a reservoir storage capacity large enough to store all the accumulated sediment deposits without encroachment on the designed water-storage volume. Typically, calculations of sediment-filling rates and sediment accumulation are part of the design of reservoir storage projects.
Distribution of Sediment Deposits
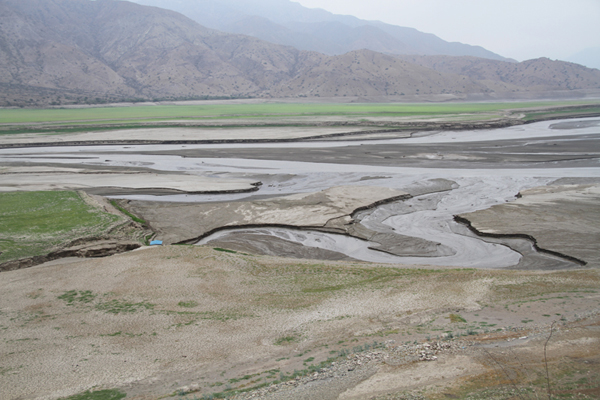
The distribution of sediment deposits may be such as to materially affect the operation and maintenance of the dam and reservoir. The amount and types of sediment deposits vary with the nature of the sediment itself, the shape of the reservoir, the topography (bathymetry) of the reservoir floor, the nature of the approach channel, detention time, and purpose of the reservoir. The coarser sediment sizes are the first to deposit in the vicinity of the reservoir entrance (Fig. 15-23). Finer sediment sizes are able to travel longer distances inside the reservoir and deposit at locations close to the dam. However, very fine sediments are usually uniformly distributed in the reservoir bed.
Figure 15-23 Sediment deposition at tail of Torata reservoir, Cuajone, Peru. |
Sediment retention, or Debris, Basins
Sediment retention basins, or debris basins, are small reservoirs located in upland areas with the specific purpose of trapping sediment and debris before they are able to reach the main fluvial network system. Debris is a general term used to describe the assortment of cobbles, boulders, branches, and other vegetative material that may clog channels and hydraulic structures, causing them to reach a critical design condition prematurely and often resulting in structural failure.
Debris basins are placed upstream of channels or reservoirs with the specific purpose of temporary detainment of debris. Debris basins are usually small and designed to be cleaned out from time to time. Some basins are sized to fill up during one or two major storms. Others may have a 50- or 100-y design life. Project costs and site conditions determine the size of debris basins.
Sediment yield determinations for debris basin design should include both short-term and long-term analyses. The long-term sediment yield is determined from the appropriate sediment rating curve. For infrequent storms, however, sediment concentrations may exceed long-term averages by a factor of 2 or 3 [43].
Example 15-12.
A planned reservoir has a total capacity of 10 hm3 and a contributing catchment area of 250 km2.
Mean annual runoff at the site is 400 mm, annual sediment yield is 1000 metric tons/km2, and the specific weight of sediment deposits is estimated at 12,000 N/m3.
A sediment source study has confirmed that the sediments are primarily fine-grained.
Calculate the time that it will take for the reservoir to fill up to 80% and to 100% with sediments.
The calculations are shown in Table 15-9.
Because of decreased reservoir capacity as it fills with sediment, an interval of storage equal to ΔV = 1 hm3 is chosen for this example.
Column 2 shows the loss of reservoir capacity, and Col. 3 shows the accumulated sediment deposits.
The mean annual inflow to the reservoir is: 400 mm × 250 km2 = 100 hm3.
Column 4 shows the capacity-inflow ratios at the end of each interval, and Col. 5 shows the average capacity-inflow ratios per interval.
Column 6 shows the trap efficiencies Ti obtained from Fig. 15-21 using the curve for fine-grained sediments (lower curve).
The annual sediment inflow Is is:
1000 ton/km2/y × 1000 kg/ton × 250 km2 × 9.81 N/kg
Is = 0.204 hm3/y
The number of years to fill each ΔV interval is: ΔV / [Is (Ti /100)], shown in Col. 7.
The time for the reservoir to fill up to 80% of capacity is 60 y.
The time to fill up to 100% of capacity is 114 y.
Using ONLINE RESERVOIR LIFE, the results of Table 15-9 are confirmed.
Figure 15-24 Filling of a large reservoir with sediments.
| |||||||||||||||||||||||||||||||||||||||||||||||||||||||||||||||||||||||||||||||||||||||||||||||||||||||||||||||||||||||||||||
15.5 SEDIMENT MEASUREMENTS
|
|
The measurement of fluvial sediments is often necessary to complement sediment yield and sediment transport studies. The accuracy of the measurement, however, is dependent not only on the equipment and techniques but also on the application of basic principles of sediment transport.
As sediment enters a stream or river, it separates itself into bed-material load and wash load. In turn, the bed-material load is transported as either bed load or suspended load. The suspended bed-material load plus the wash load constitutes the total suspended sediment load of the stream or river.
The term sampled suspended sediment discharge is used to describe the fraction of suspended sediment load that can be sampled with available equipment. Generally, it excludes the unsampled suspended sediment discharge, i.e., the fraction of suspended sediment ioad that is carried too close to the stream bed to be effectively sampled. The suspended sediment discharge is the sum of sampled plus unsampled suspended sediment discharges.
Sediment Sampling Equipment
Sediment sampling equipment can be classified as follows:
- Suspended sediment samplers, which measure suspended sediment concentration,
- Bedload samplers, which measure bedload, and
- Bed material samplers, which sample the sediment in the top layer of the streambed.
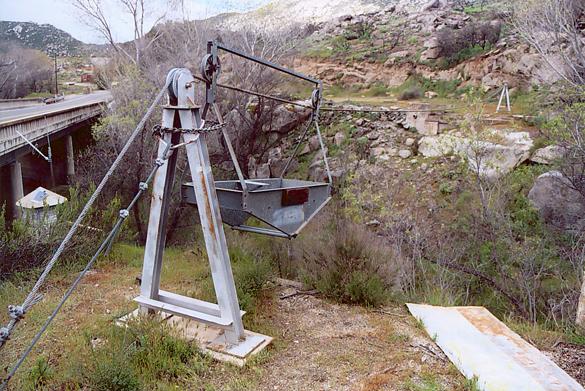
Suspended sediment samplers. Suspended-sediment samplers can be classified as: (1) depth-integrating, (2) point-integrating, or (3) single-stage. Depth-integrating samplers accumulate a water-sediment sample in a pint-size milk bottle as they are lowered to the streambed and raised back to the surface at a uniform rate of transit. They are designed so that the velocity in the intake nozzle is nearly equal to the local stream velocity. Samples may be collected by wading in a stream, by hand from a suitable support, or mechanically with a cable-and-reel setup (Fig. 15-25).
Figure 15-25 Cable and reel setup, Campo Creek at Campo gaging station, San Diego County, California. |
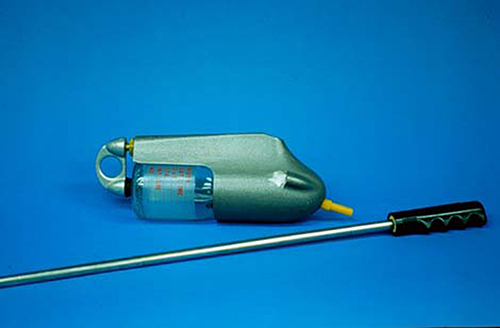
The US DH-48 sampler (3.5 lb) (Fig. 15-26) is a lightweight hand-held depth-integrating sampler used for the collection of suspended sediment samples in wadeable streams. It is designed to sample isokinetically, meaning that water and sediment enter the nozzle at the same velocity as the stream being sampled, in order to collect a representative sample. This sampler is used in shallow streams when the product of flow depth (in feet) and mean velocity (in feet per second) does not exceed 10 [22].
Figure 15-26 US DH-48 depth-integrating suspended sediment sampler. |
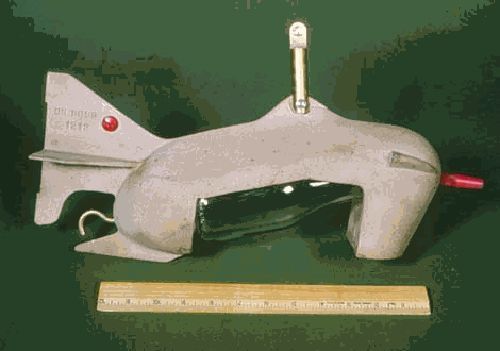
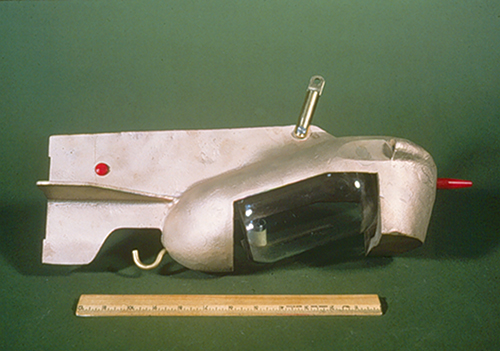
The US DH-59 and US DH-76 samplers (22 and 25 lbs, respectively) with handline suspension are used in streams with low velocities but with depths that do not permit samples to be collected by wading (Figs. 15-27 and 15-28). The US D-74 sampler (aluminum, 42 lbs; brass, 62 lbs) with cable-and-reel suspension is designed for use in streams beyond the range of hand-operated equipment. Depth-integrating samplers were developed to improve sampling accuracy and to reduce the cost of collecting suspended sediment data.
Figure 15-27 US DH-59 depth-integrating suspended sediment sampler. |
Figure 15-28 US DH-76 depth-integrating suspended sediment sampler. |
Point-integrating samplers accumulate a water-sediment sample that is representative of the mean concentration at any selected point in a stream during a short interval of time. The intake and exhaust characteristics of point-integrating samplers are identical to those of depth-integrating samplers. A rotary valve that opens and closes the sampler is operated by a solenoid energized by batteries at the surface. The current flows to the solenoid by a current-meter cable, which suspends the sampler. Point-integrating samplers can be used to collect depth-integrating samples by leaving the valve open as the sampler is moved through the stream vertical. This permits depth-integration in streams that are too deep to be appropriately sampled with a depth-integrating sampler. The US P-61-A1 (105 lb), US P-63 (202 lb), and US P-72 (41 lb) point-integrating samplers are in current use.
The single-stage sampler was developed to obtain suspended sediment data in flashy streams, particularly those in remote areas [24]. It is used to sample sediment at a specific depth and on the rising stage only. The sampler operates on the siphon principle, and therefore the velocity in the intake is not equal to the stream velocity. With careful operation, the single-stage sampler can be used to obtain supplemental data on suspended-sediment concentration at selected points.
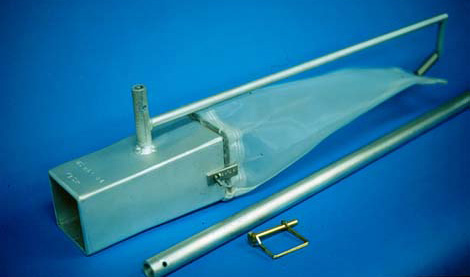
Bedload samplers. The US BLH-84 is a wading-type hand-held bedload sampler (Fig. 15-29). The sampler consists of an expanding nozzle, a sample bag, and a wading rod assembly. The ratio of nozzle area to entrance area is 1.4. A polyester mesh bag with mesh openings of 0.25 mm is attached to the rear of the nozzle assembly with an "O " ring. The sampler is constructed of aluminum and it weighs 10 lbs.
Figure 15-29 US BLH-84 bedload sampler. |
The US BL-84 is a cable-suspended bedload sampler used to collect samples from streams that cannot be waded (Fig. 15-30). The sampler consists of an expanding nozzle mounted in a frame and a sampler bag. The sampler is constructed of stainless steel and aluminum and it weighs 32 lbs.
Figure 15-30 US BL-84 bedload sampler. |
Bed-material samplers. Bed-material samplers are of three types: (1) drag bucket, (2) grab bucket, and (3) vertical-pipe, or core sampler. The drag-bucket sampler consists of a weighted section of cylinder with an open mouth and cutting edge. As the sampler is dragged upstream along the bed, it collects a sample from the top layer of bed material. The grab-bucket sampler is similar to the drag-bucket, consisting of a cylinder section attached to a rod, and used primarily in shallow streams. The vertical pipe, or core sampler, consists of a piece of metal or plastic pipe that can be forced into the stream by hand. Generally, the drag-bucket and grab-bucket samplers do not obtain representative samples of bed material because of the loss of fine material. The core sampler is satisfactory for use in shallow streams.
The US BMH-53 sampler consists of a 8-in.-long, 2-in.-diameter brass or stainless steel pipe with a cutting edge and suction piston attached to a control rod. The sampler weighs 7.5 lbs (Fig. 15-31). The piston is retracted as the cutting cylinder is forced into the streambed. The partial vacuum that develops in the sampling chamber as the piston is withdrawn assists in holding the sample in the cylinder. The sampler can be used only in streams shallow enough to be waded.
Figure 15-31 US BMH-53 bed material sampler. |
The US BMH-60 bed material sampler is designed to scoop up a sample of bed sediment about 3 in. wide and 2 in. deep. At the close of the sampling operation, the cutting edge rests against a rubber stop, which prevents any sediment from being lost. The sampler is made out of aluminum, it is 22 in. long and it weighs 32 lbs (Fig. 15-32). It is used to collect bed-material-sediment samples in streams with low velocities but with depths beyond the range of the BMH-53 sampler.
Figure 15-32 US BMH-60 bed material sampler. |
The US BM-54 bed-material sampler (100 lb) with cable suspension is similar in
design to the BHM-60 sampler. The sampler is made out of cast iron, it is 22 in. long and it weighs
100 lbs
Figure 15-33 US BM-54 bed material sampler. |
Table 15-10 lists sediment samplers in common use, developed by the U.S. Federal Interagency Sedimentation Project.
| To sample | Sampler ID | Weight (lbs) | Applicable to |
| Suspended sediment | DH-48 | 3.5 | Velocity × depth < 10 ft2/s |
| DH-59, DH-76 | 22, 25 | Deeper streams, not wadable | |
| D-74 | 42 (aluminum); 62 (brass) | Large streams | |
| Bed load | BLH-84 | 10 | Shallow streams, wadable |
| BL-84 | 32 | Any depth, deeper streams | |
| Bed material | BMH-53 | 7.5 | Shallow streams, wadable |
| BMH-60 | 32 | Handline, low velocity | |
| BM-54 | 100 | Any depth, deeper streams | |
Suspended-sediment Discharge Measurements
Suspended-sediment samplers are used to determine sediment concentration at a point in a stream (i.e., a stream vertical), except for a small unmeasured zone located just above the stream bed. With wading equipment, measurements can generally be made down to within 0.3 ft of the stream bed. For cable-supported equipment, the unmeasured zone varies between 0.5 and 1.0 ft, depending on the size of sampler used.
Suspended-sediment discharge measurements include: (1) suspended-sediment concentration, (2) particle size, (3) specific gravity, (4) temperature of water-sediment mixture, (5) water discharge, and (6) distribution of flow in the stream cross section.
The streamflow depth and velocity and the facilities at the sampling site (bridge, cableway, and so on) have an influence on the choice of sampler. Stream depth determines whether hand samplers, such as the DH-48 or DH-59, or a cable-suspended sampler, such as the D-74, should be used. Flow depths over 15 ft require the use of point-integrating samplers to avoid overfilling of the sampling bottles. The larger the product of flow depth times mean velocity, the heavier the sample required for proper measurement.
The number of sampling verticals depends on the desired accuracy and the variation of sediment concentration across the stream. For streams with a stable cross section and essentially uniform sediment concentration across the width, sampling at a single vertical is usually adequate.
Depth-integrating samplers produce a suspended-sediment concentration, which can be measured in parts per million and converted to milligrams per liter. The suspended-sediment discharge is given by the following formula:
| Qs = 0.0027 Cs Q | (15-33) |
in which Qs = suspended sediment discharge, in tons per day; Cs = suspended-sediment concentration, in milligrams per liter; Q = water discharge, in cubic feet per second, and 0.0027 is the conversion factor for the indicated units. Table 15-8 shows a factor to convert concentration in parts per million to milligrams per liter.
There are two techniques to measure suspended-sediment discharge: (1) EDI, or equal-discharge increments, and (2) ETR, or equal-transit rate. In the EDI method, sampling is done at the centroids of equal-discharge increments. In the ETR method, sampling is done at the centroids of equal-length increments.
The EDI method requires a knowledge of the lateral distribution of streamflow prior to the selection of sampling verticals. The ETR method is applicable to shallow streams where the cross-sectional distribution of streamflow is not stable. Generally, the EDI method requires fewer sampling verticals than the ETR method. The ETR method, however, does not require a prior discharge measurement. The suspended-sediment concentration in the EDI method is the average obtained from several depth-integrating samples. In the ETR method, the suspended sediment concentration is that of a composite sample encompassing several depth-integrating samples.
The error in suspended-sediment discharge provided by the measurement varies with the depth of the unsampled zone and the size distribution of suspended load. The error tends to be smallest in the cases where the vertical concentration gradient in the unsampled zone is small. The concentration gradient near the bed is small for silt and clay particles and large for coarser sand particles. Corrections in sampled suspended sediment discharge to account for the unsampled portion are usually obtained through appropriate sediment transport predictors such as the Colby 1957 method or the Modified Einstein Procedure [7, 9].
QUESTIONS
|
|
- Give two alternate definitions of particle sphericity.
What is the difference between specific weight and specific gravity?
What is standard fall velocity? What is standard fall diameter?
What is the difference between sediment production and sediment yield?
Describe the differences between normal and accelerated erosion.
Name four sources of sediment.
What is the rainfall factor R in the Universal Soil Loss Equation?
What is sediment delivery ratio?
Why is sediment delivery ratio inversely related to drainage-basin area?
Why are two formulas needed in the Dendy and Bolton approach to the computation of sediment yield?
Describe the classifications of sediment load based on: (1) predominant mode of transport, and (2) whether the particle sizes are represented on the channel bed.
What are possible forms of bed roughness in alluvia! channels?
What is range of applicability of the Meyer-Peter formula for bedload transport?
What is the basic difference between the Colby 1957 and Colby 1964 procedures for the computation of discharge of sands?
What is a sediment rating curve?
What is sediment routing?
What is the trap efficiency of a reservoir?
What is a debris basin?
Describe two techniques to measure suspended-sediment discharge. How do they differ in the evaluation of suspended sediment concentration?
PROBLEMS
|
|
Calculate the fall velocity of a sediment particle using Stokes' law. Assume a diameter 0.1 mm, kinematic viscosity 1 centistoke, and specific gravity 2.65.
Calculate the specific weight of a sediment deposit in a reservoir, after an elapsed time of 100 y, under moderate drawdown conditions. Assume the following mix of particle sizes: sand 55%, silt 30%, clay 15%.
Compute the average annual soil loss by the universal soil loss equation for a 300-ac watershed near Lexington, Kentucky, with the following conditions: (1) cropland, 250 ac, contoured, soil is Keen silt loam, slopes are 7% and 150 ft long, C = 0.15; (2) pasture, 50 acres, 75% canopy cover, 60% ground cover with grass, soil is Ida silt loam, slopes are 10% and 200 ft long.
Compute the average annual soil loss by the universal soil loss equation for a 1-mi2 forested watershed near Bangor, Maine. The soil is Fayette silt loam, the slopes are 3% and 300 ft long, and the site is 80% covered by forest litter.
Using the Dendy and Bolton formula, calculate the sediment yield for a 25.9-km2 watershed with 5 cm of mean annual runoff.
Determine whether a particle of 2-mm diameter is at rest under a 3-m flow depth and 0.0002 channel slope. Assume a specific gravity 2.65 and kinematic viscosity 1 centistoke.
Determine the form of bed roughness that is likely to prevail under the following flow conditions: mean velocity 3 ft/s, flow depth 8 ft, channel slope 0.0002, and mean particle diameter 0.3 mm.
Given the following flow characteristics: flow depth 9 ft, mean velocity 3 ft/s, channel slope 0.00015, mean particle diameter 0.4 mm, mean channel width 250 ft. Calculate the bed material transport rate by the Duboys formula.
Given the following flow characteristics: flow depth 3 ft, mean velocity 5 ft/s, energy slope 0.009, mean particle diameter 1.0 in., mean channel width 30 ft. Calculate the bed�material transport rate (in tons per day) by the Meyer-Peter formula.
Given the following flow characteristics: flow depth 5 ft, mean velocity 4 ft/s, mean channel width 180 ft, measured concentration of suspended bed material discharge 200 ppm. Calculate the total bed-material discharge (in tons per day) by the Colby 1957 method.
Given the following flow characteristics: flow depth 5 ft, mean velocity 3 ft/s, median bed material size 0.3 mm, mean channel width 225 ft, water temperature 70°F, wash load concentration 300 ppm. Calculate the discharge of sands by the Colby 1964 method.
A reservoir is to be built with a total storage capacity of 50 hm3. The contributing drainage basin is 800 km2, and the mean annual runoff at the site is 200 mm. Assume well-graded sediment deposits with average specific weight 1400 kg/m3. (a) How long will it take for the reservoir to lose 20% of its storage volume? (b) How long will it take for the reservoir to fill up with sediment? Estimate sediment yield by the Dendy and Bolton formula.
A reservoir is to be built with a total storage capacity of 120 hm3. The contributing drainage basin is 425 km2, and the mean annual runoff at the site is 45 mm. Assume coarse sediment deposits with average specific weight 13 kN/m3. (a) How long will it take for the reservoir to lose 80% of its storage volume? (b) How long will it take for the reservoir to fill up with sediment? Estimate sediment yield by the Dendy and Bolton formula.
Derive the conversion factor 0.0027 in Eq. 15-33.
Calculate the suspended sediment discharge (in tons per day) for the following cases: (1) suspended sediment concentration 100 ppm, water discharge 1200 ft3/s, and (2) suspended sediment concentration 80,000 ppm, and water discharge 5000 ft3/s.
Derive the unit conversion factor C in the following formula: Qs = C Cs Q, in which Qs is given in kilonewtons per day, Cs in milligrams per liter, and Q in cubic meters per second.
Calculate the suspended sediment discharge (in kilonewtons per day) for a suspended sediment concentration of 150 ppm and a flow of 68 m3/s.
Calculate the suspended sediment discharge (in kilonewtons per day) for a suspended sediment concentration of 22,000 ppm and a flow of 155 m3/s.
REFERENCES
|
|
Ackers, P., and W. R. White. (1 973). "Sediment Transport: A New Approach and Analysis," Journal of the Hydraulics Division, ASCE, Vol. 99, No. HYll, Nov. , pp. 2041-2060.
American Society of Civil Engineers. (1975). Sedimentation Engineering, Manual No. 54.
Brown, C. B. (1950). "Sediment Transportation," Chapter XII, Engineering Hydraulics. H. Rouse, ed.. New York: John Wiley.
Chang, H. H. (1988). Fluvial Processes in River Engineering. New York: Wiley Interscience.
Chow, V. T. (1959). Open Channel Hydraulics. New York: McGraw-Hill.
Colby, B. R., and C. H. Hembree. (1955). "Computations of Total Sediment Discharge, Niobrara River Near Cody, Nebraska," U.S. Geological Survey Water-Supply Paper 1357, Washington, D.C.
Colby, B. R. (1957). "Relations of Unmeasured Sediment Discharge to Mean Velocity," Transactions. American Geophysical Union, Vol. 38, No. 5, Washington, D.C., Oct., pp. 707-717.
Colby, B. R. (1964). "Practical Computations of Bed Material Discharge," Journal of the Hydraulics Division, ASCE, Vol. 90, No. HY2, March, pp. 217-246.
Colby, B. R. (1964). "Discharge of Sands and Mean Velocity Relations in Sand-Bed Streams," U.S. Geological Survey Professional Paper 462-A, Washington, D.C.
Collier, C. R., R. J. Pickering, and J. J. Musser. (1970). "Influences of Strip Mining on the Hydrologic Environment of Parts of Beaver Creek Basin, Kentucky, 1955-1966", U.S. Geological Survey Professional Paper 427-C, Washington, D.C.
Copper, R. H., and A. W. Peterson. (1970). Discussion of "Coordination in Mobile Bed Hydraulics," Journal of the Hydraulics Division, ASCE, Vol. 96, No. HY9, Sept., pp. 1880-1886.
Corey, A. T. (1949). "Influence of Shape on the Fall Velocity of Sand Grains," M.S. Thesis, Colorado State University, Fort Collins, Colorado.
Dendy, F. E. , and G. C. Bolton. (1976). "Sediment Yield-Runoff-Drainage Area Relationships in the United States," Journal of Soil and Water Conservation, Vol. 31, No.6, November- December, pp. 264-266.
DuBoys, P. (1879). "Le Rohne et les Rivieres a Lit Affouillable," Annales de Ponts et Chausées, Series 5, Vol. 18, pp. 141-195.
Einstein, H. A. (1950). "The Bed-Load Function for Sediment Transportation in Open Channel Flows," USDA Soil Conservation Service, Technical Bulletin No. 1026, Washington, D.C., September.
Engelund, F., and E. Hansen. (1967). "A Monograph on Sediment Transport in Alluvial Streams," Teknisk Vorlag. Copenhagen, Denmark.
Flaxman, E. M. (1972). "Predicting Sediment Yield in the Western United States," Journal of the Hydraulics Division, ASCE, Vol. 98, HY12, pp. 2073-2085.
Geiger, A. F. (1965). "Developing Sediment Storage Requirements for Upstream Retarding Reservoirs," Proceedings of Federal Interagency Sedimentation Conference, Jackson, Miss., USDA Agricultural Research Service, Miscellaneous Publication No. 970, pp. 881-885.
Guy, H. P. (1969). "Laboratory Theory and Methods for Sediment Analysis," U.S. Geological Survey, Techniques for Water Resources Investigations, Book 5, Chapter C1.
Guy, H. P. (1970). "Fluvial Sediment Concepts," U.S. Geological Survey, Techniques for Water Resources Investigations, Book 3, Chapter Cl, 1970.
Hydrologic Engineering Center, U.S. Army Corps of Engineers. (2010). "HEC-RAS, River Analysis System," Version 4.1, User's Manual, January.
Interagency Committee on Water Resources. (1952). "The Design of Improved Types of Sediment Samplers," Report No. 6. Subcommittee on Sedimentation, Federal Interagency River Basin Committee, Hydraulic Laboratory of the Iowa Institute of Hydraulic Research, Iowa City, Iowa.
Interagency Committee on Water Resources. (1957). "Some Fundamentals of Particle Size Analysis. A Study of Methods Used in Measurement and Analysis of Sediment Loads in Streams," Report No. 12. Subcommittee on Sedimentation, Saint Anthony Falls Hydraulic Laboratory, Minneapolis. Minnesota.
Interagency Committee on Water Resources. (1961). "The Single-Stage Sampler for Suspended Sediment," Report No. 13, Subcommittee on Sedimentation, Saint Anthony Falls Hydraulic Laboratory, Minneapolis, Minnesota.
Jansen, P. Ph., L. van Bendegom, J. van den Berg. M. de Vries, and A. Zanen. (1979). Principles of River Engineering. London: Pitman.
Julien, P. Y. 1995. Erosion and sedimentation. Cambridge University Press.
Kennedy, J. F. (1983). "Reflections on Rivers, Research, and Rouse." Journal of Hydraulic Engineering, ASCE, Vol. 109, No. 10, October, pp. 1254-1271.
Lane, E. W. (1947). "Report of the Subcommittee on Sediment Terminology," Transactions. American Geophysical Union, Vol. 28, No.6. December. pp. 936-938.
Lane, E. W., and V. A. Koelzer. (1953). "Density of Sediments Deposited in Reservoirs," A Study of Methods Used in Measurement and Analysis of Sediment Loads in Streams, Report No. 9, St. Paul U.S. Army Engineer District, St. Paul, Minnesota.
Lane, E. W. (1955). "Design of Stable Channels," Transactions, ASCE, Vol. 120, Paper No. 2776, pp. 1234-1279.
Lane, E. W. (1955). "The importance of fluvial morphology in hydraulic engineering," Proceedings, ASCE, Vol. 81, Paper No. 745, July, pp. 1-17.
Leifeste, D. K. (1974). "Dissolved-Solids Discharge to the Oceans from the Conterminous United States," U.S. Geological Survey Circular No. 685.
Leopold, L. B .. W. W. Emmett, and R. M. Myrick. (1966). "Channel and Hillslope Processes in a Semiarid Area in New Mexico," U.S . Geological Survey, Professional Paper No. 352-G, Washington, D.C.
McNown, J. S., and J. Malaika. (1950). "Effect of Particle Shape on Settling Velocity at Low Reynolds Number," Transactions. American Geophysical Union, Vol. 31, No.1, Feb., pp. 74-82.
Meyer-Peter, E., and R. Muller. (1948). "Formulas for Bed Load Transport," Report on Second Meeting of International Association of Hydraulic Research, Stockholm, Sweden, pp. 39-64.
Ponce, V. M. (2015). "The Lane relation revisited, with online calculation," Online article.
http://ponce.sdsu.edu/lane_relation_revisited_pubs_and_calcs.htmlRoehl, J. W. (1962). "Sediment Source Areas, Delivery Ratios, and Influencing Morphological Factors," Publication 59, International Association of Scientific Hydrology, Commission on Land Erosion, pp. 202-213.
Rouse, H. (1937). "Nomograph for the Settling Velocity of Spheres," Division of Geology and Geography, Exhibit D of the Report of the Commission on Sedimentation, 1936-1937, National Research Council, Washington, D.C., October, pp. 57-64.
Rouse, H. (1939). "An Analysis of Sediment Transportation in the Light of Fluid Turbulence," USDA Soil Conservation Service, Report No. SCS-TP-25, Washington, D.C.
Simons, D. B., and E. V. Richardson. (1966). "Resistance to Flow in Alluvial Channels," U.S. Geological Survey, Professional Paper No. 422J, Washington, D.C.
Simons, D. B., and F. Senturk. (1976). Sediment Transport Technology. Fort Collins, Colorado: Water Resources Publications.
Toffaleti, F. B. (1969). "Definitive Computation of Sand Discharge in Rivers," Journal of the Hydraulics Division, ASCE, Vol. 95, No. HY1, Jan., pp. 225-248.
U.S. Army Corps of Engineers. (1987). "Sedimentation Investigations in Rivers and Reservoirs," Engineer Manual EM 1110-2-4000, Office of the Chief of Engineers, Washington, D.C., Draft.
USDA Soil Conservation Service. (1983). National Engineering Handbook. Section 3, Sedimentation, 2d. ed., now released as Part 632.
Williams, J. R. (1975). "Sediment Yield Prediction with the Universal Soil Loss Equation Using Runoff-Energy Factor," in Present and Prospective Technology for Predicting Sediment Sources and Sediment Yields. USDA Agricultural Research Service, Publication ARS-S-40.
Wischmeier, W. H., and D. D. Smith. (1965). "Predicting Rainfall-Erosion Losses from Cropland East of the Rocky Mountains," USDA Agricultural Research Service, Agriculture Handbook No. 282 . May.
Wischmeier, W. H., C. B. Johnson, and B. V. Cross. (1971). "A Soil Erodibility Nomograph for Farmland and Construction Sites," Journal of Soil and Water Conservation, Vol. 26, No.5, Sept.-Oct.
Wolman, M. G., and A. P. Schick. (1967). "Effects of Construction on Fluvial Sediment, Urban and Suburban Areas of Maryland," Water Resources Research, Vol. 3, No.2, pp. 451-464.
Yang, C. T. (1972). "Unit Stream Power and Sediment Transport," Journal of the Hydraulics Division, ASCE, Vol. 98, No. HY10, Oct., pp. 1805-1826.
SUGGESTED READINGS
American Society of Civil Engineers. (1975). Sedimentation Engineering, Manual No. 54.
Colby, B. R. (1964). "Discharge of Sands and Mean Velocity Relations in Sand-Bed Streams," U.S. Geological Survey Professional Paper 462-A, Washington, D.C.
Guy, H. P. (1970). "Fluvial Sediment Concepts," U.S. Geological Survey, Techniques for Water Resources Investigations. Book 3, Chapter C1, 1970.
U.S. Army Corps of Engineers. (1987). "Sedimentation Investigations in Rivers and Reservoirs," Engineer Manual EM 1110-2-4000, Office of the Chief of Engineers, Washington, D.C., Draft.
USDA Soil Conservation Service. (1983). National Engineering Handbook. Section 3, Sedimentation, 2d. ed., currently released as Part 632.
| http://engineeringhydrology.sdsu.edu |
|
200826 12:00 |
